For any B2B decision-maker, from founders to ecommerce managers, the inventory turnover ratio is more than an accounting metric—it's a critical indicator of operational health. It measures how many times a company has sold and replaced its entire stock over a specific period. In commercial terms, it's the speed at which you convert inventory into revenue.
A high ratio suggests strong sales and efficient purchasing. A low ratio, however, is a warning sign of overstocking, weak demand, and capital needlessly tied up in physical goods.
Why Inventory Turnover Is a Critical Business Metric
Think of your warehouse stock as capital in a physical form. The longer it sits, the more it costs in storage, insurance, and the risk of obsolescence. The goal is to convert it back to cash as efficiently as possible. Your inventory turnover ratio is the scorecard for this process.
For a business leader, this metric is fundamental to strategic planning. It directly impacts cash flow, profitability, and market agility. A business with a healthy turnover can react faster to a competitor’s price drop, capitalize on a sudden surge in demand, or pivot its product mix in response to market shifts.
The Commercial Impact of Your Turnover Ratio
Understanding the inventory turnover ratio elevates inventory management from a logistical task to a strategic lever for the entire business. It informs critical decisions across multiple departments.
- Pricing Strategy: Is a product’s turnover rate declining? This is a clear signal its price may be misaligned with the market. This data should trigger an immediate review of competitor pricing to see if a price adjustment is needed to stimulate sales.
- Marketing and Promotions: Slow-moving items are prime candidates for targeted marketing campaigns. Promotions, product bundles, or a clearance sale can be used to liquidate this stock, freeing up both capital and warehouse space for more profitable products.
- Supply Chain and Purchasing: A consistently high turnover may indicate under-ordering, leading to stockouts and lost sales. Conversely, a low turnover shows that capital is tied up in products that aren't selling—funds that could be better invested in growth initiatives.
Before we get into the calculation, let's break down the core components and their practical business implications.
Core Components of Inventory Turnover
This table provides a quick reference for the key elements of the inventory turnover ratio and what they mean commercially.
| Component | What It Means for Your Business |
|---|---|
| Cost of Goods Sold (COGS) | The direct cost of acquiring or producing the goods you sell. A higher COGS with steady sales means lower gross margins. |
| Average Inventory | The average value of your inventory over a period, representing the working capital invested in physical stock. |
| The Ratio (COGS / Average Inventory) | The final metric indicating how many times you've sold through your entire stock. It is a direct measure of inventory efficiency. |
Each part of this formula provides a piece of the puzzle, revealing how well you are balancing supply with customer demand.
The inventory turnover ratio doesn't just track stock movement; it measures your company's ability to efficiently convert working capital into revenue. It’s a direct reflection of your operational agility.
What Is a Good Inventory Turnover Ratio?
The ideal ratio varies significantly by industry—a grocery distributor will have a much higher turnover than a heavy machinery manufacturer. However, some general benchmarks exist.
Across most retail and ecommerce sectors, a good inventory turnover ratio typically falls between 5 and 10. This range suggests you are selling and replenishing your entire stock every 1-2 months. Achieving this indicates a healthy balance between meeting demand and controlling carrying costs. You can find more insights on ideal inventory turnover rates on Extensiv.com.
Mastering this metric allows you to optimize stock levels, protect profit margins, and ensure your capital is productive. This is where automated price monitoring tools like Market Edge become useful, providing the real-time pricing and stock data needed to make decisions that directly improve your turnover.
Calculating Your Inventory Turnover Ratio
Calculating your inventory turnover ratio is straightforward, but the real value lies in understanding what the result means for your business. The formula is designed to reveal how effectively you are converting on-shelf products into cash.
Inventory Turnover Ratio = Cost of Goods Sold (COGS) / Average Inventory
This simple equation provides a powerful insight into your operational health, telling you exactly how many times your business sold through its entire inventory in a given period.
Breaking Down the Formula Components
Accurate calculation requires a firm grasp of its two main components: Cost of Goods Sold and Average Inventory. Errors in these inputs will produce a misleading ratio and can lead to poor strategic decisions.
-
Cost of Goods Sold (COGS): This figure represents the direct costs of the products you sold, including raw materials and direct labor. It excludes indirect expenses like marketing or administrative overhead. For a detailed breakdown, see our guide on how to calculate your Cost of Goods Sold.
-
Average Inventory: This is the average value of your inventory over a specific time. An average is used because inventory levels can fluctuate significantly due to seasonal demand, large supplier shipments, or clearance events. Using only the beginning or ending inventory value could provide a distorted view of your typical stock levels.
The formula for Average Inventory is:
Average Inventory = (Beginning Inventory + Ending Inventory) / 2
Using an average provides a more balanced and accurate baseline for your calculation. It prevents a single large order or a month-end stockout from skewing the results and misrepresenting your inventory management performance.
The entire process measures the efficiency of converting physical stock into cash.
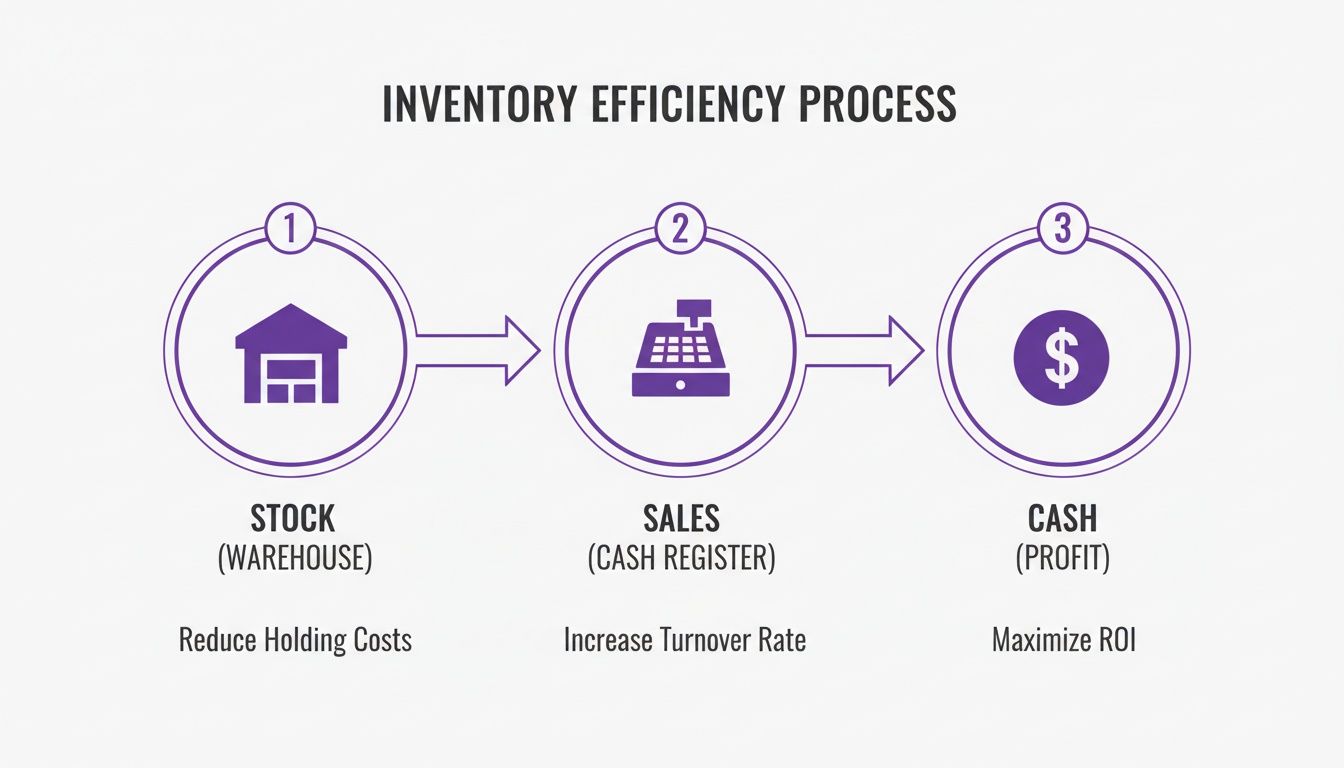
As shown, the faster you move through this cycle, the more quickly you generate cash—the lifeblood of any commercial enterprise.
A Practical Calculation Example
Let's apply this to a real-world scenario. Consider an online electronics retailer, "GadgetPro," calculating its turnover ratio for the last fiscal year.
-
Gather the Data:
- Beginning Inventory (Value on Jan 1): $200,000
- Ending Inventory (Value on Dec 31): $300,000
- Cost of Goods Sold (for the full year): $1,500,000
-
Calculate Average Inventory:
- First, we determine the average stock value: ($200,000 + $300,000) / 2 = $250,000
-
Calculate the Inventory Turnover Ratio:
- Now, we apply the main formula: $1,500,000 (COGS) / $250,000 (Average Inventory) = 6
GadgetPro’s inventory turnover ratio is 6. This means the company sold and restocked its entire inventory six times during the year, or approximately every two months.
Converting the Ratio to Days Sales of Inventory
A ratio of 6 is useful, but converting it into "days" makes it more intuitive for operational planning. This metric is known as Days Sales of Inventory (DSI) or Days Inventory Outstanding.
The DSI formula is a simple conversion:
DSI = 365 / Inventory Turnover Ratio
For GadgetPro, with its ratio of 6:
- 365 / 6 = 60.8 days
This tells us that, on average, a product sits in GadgetPro's warehouse for just under 61 days before it is sold. For an operations or pricing manager, this number is invaluable. It helps establish reorder points, plan promotions for items approaching the 60-day mark, and forecast cash flow by predicting when capital tied up in inventory will be converted to revenue.
What Is a Good Inventory Turnover Ratio, Really?
Once you have calculated your inventory turnover ratio, the next step is interpretation. The number itself is just data; its value comes from understanding what it reveals about your business performance. A high ratio generally indicates efficiency, while a low ratio often signals problems like overstocking, weak demand, or product obsolescence.
Crucially, there is no universal "good" ratio. The ideal number is industry-dependent. While a global average across sectors might be around 8.5, this figure is largely irrelevant for specific businesses. For general retail, a healthy turnover typically falls between 2 and 4.5. You can explore these industry-specific stock turnover benchmarks on Timly.com for more relevant comparisons.
When a High Turnover Ratio Isn't as Good as It Looks
A high turnover rate may seem like the ultimate goal, suggesting products are selling quickly and cash flow is strong. However, an extremely high ratio can mask underlying issues that harm profitability.
- Frequent Stockouts: Selling inventory too quickly often leads to stockouts. This results in lost sales and can erode customer loyalty, driving buyers to competitors who maintain adequate stock levels.
- Increased Operational Costs: To sustain a very high turnover, businesses often place smaller, more frequent orders. This can increase shipping and administrative costs, quietly diminishing the margins you aim to protect.
- Missed Bulk Discounts: Small, frequent orders may not meet the volume thresholds required for supplier discounts, directly increasing your cost of goods sold (COGS) and reducing profitability.
A high turnover ratio signals efficiency, but if it gets too high, you might be sacrificing sales and profit for speed. The real goal is optimal turnover, not maximum turnover.
The Clear Dangers of a Low Turnover Ratio
A low inventory turnover ratio is a less ambiguous and more direct signal that inventory is not converting to cash quickly enough. This creates a cascade of financial problems that can impede business growth.
The primary consequences include:
- Tied-Up Working Capital: Every unsold product represents capital that could be invested in growth, marketing, or product development. Instead, it remains unproductive on a shelf.
- High Carrying Costs: The longer an item is stored, the more it costs in warehousing, insurance, and potential damage or obsolescence. These costs directly erode profit margins.
- Ineffective Sales or Pricing Strategy: A low ratio is often a direct result of poor product performance. The root cause could be weak market demand, ineffective marketing, or a price point that is not competitive.
A Tale of Two Retailers
To understand why context is crucial, consider two different ecommerce businesses: a fast-fashion brand and a high-end, custom furniture store.
- The Fast-Fashion Brand: This business operates on rapidly changing trends. An excellent turnover ratio might be 10 or higher. A ratio of 3 would be a commercial failure, indicating that styles are becoming obsolete and will require significant markdowns.
- The Custom Furniture Store: Here, items are expensive and often made-to-order. A turnover ratio of 2 or 3 could be exceptional. It reflects a business model built on craftsmanship and longer sales cycles, not high-volume velocity.
This comparison highlights the importance of benchmarking your ratio against direct competitors and industry norms, not a generic average. This is where tools like Market Edge become valuable, providing the competitive pricing and stock intelligence needed to assess your performance accurately.
Actionable Strategies to Improve Inventory Turnover
Knowing your inventory turnover ratio is the first step. Improving it is where you drive tangible financial results. A low turnover ratio represents trapped cash, wasted warehouse space, and missed growth opportunities.
Fortunately, several strategic levers can be used to accelerate stock movement and improve your bottom line. By focusing on intelligent pricing, a curated product mix, and supply chain efficiency, you can transform inventory from a liability into a high-performing asset.

Implement Dynamic Pricing to Move Aging Stock
One of the most effective methods for accelerating sales is dynamic pricing. This involves adjusting product prices in response to real-time market conditions, such as competitor prices, stock levels, and demand fluctuations. It is a highly effective way to move aging inventory before it becomes obsolete.
For example, if a product has been in stock for over 90 days, an automated pricing rule could trigger a small, competitive price reduction. This minor adjustment might be all that is needed to win the sale without resorting to deep discounts that damage margins. A real-world use case involves MAP/RRP enforcement: if a competitor violates MAP, you can hold your price, but if they run out of stock, you can capture demand by ensuring your price is competitive.
Optimize Your Product Assortment
Not all products contribute equally to profitability. A common mistake is continuing to invest in slow-moving SKUs that consume resources and capital. Assortment optimization is the disciplined process of identifying underperforming products and discontinuing them to make room for high-turnover items.
Begin by analyzing sales data to identify the bottom 10% of products by sales volume over the last six months. For each of these underperformers, ask critical questions:
- Is the price competitive?
- Is it being marketed effectively?
- Does this product still align with our brand and customer base?
If a clear path to improving performance cannot be identified, it is time to discontinue the product. Liquidate the remaining stock through a clearance sale or product bundle and, most importantly, cease reordering. This action immediately frees up capital and shelf space for proven sellers.
Use Strategic Promotions and Bundling
When faced with excess inventory, the goal is to clear it without devaluing your brand or conditioning customers to expect discounts. Strategic promotions and product bundling are effective tactics for achieving this.
Instead of a generic, site-wide sale, consider pairing a slow-moving accessory with a bestselling product and offering a modest discount on the bundle. This increases the perceived value for the customer and helps move the underperforming item without marking it down individually.
Another effective strategy is a "Buy One, Get One 50% Off" promotion limited to specific categories with excess stock. This encourages larger purchases, increasing the average order value while clearing targeted inventory.
Improve Supplier Collaboration and Forecasting
Your inventory turnover is directly linked to your supply chain efficiency. Long lead times and high minimum order quantities (MOQs) from suppliers can force you to hold excess stock, tying up cash and increasing risk. Building stronger supplier relationships can lead to more favorable terms. For more on this, see our guide on how to negotiate with suppliers.
Simultaneously, you must improve demand forecasting. Analyze historical sales data, identify seasonal trends, and monitor market signals, including competitor activity. This intelligence allows for more accurate demand prediction, enabling smaller, more frequent orders—closer to a Just-In-Time model—rather than large bulk purchases that sit for months.
A vendor-neutral market intelligence tool provides the competitor data needed for sharper forecasting. When you can see how competitor prices and stock levels are changing, you can make smarter purchasing decisions that keep your inventory lean and agile. An example solution is Market Edge.
Comparing Strategies to Improve Inventory Turnover
This table provides a quick overview of these tactics to help you prioritize your efforts. The best approach often involves a combination of strategies tailored to your specific business needs.
| Strategy | Primary Impact Area | Best For |
|---|---|---|
| Dynamic Pricing | Sales Velocity & Margin | Quickly moving aging stock and capitalizing on competitor out-of-stocks without deep discounts. |
| Assortment Optimization | Capital Efficiency | Freeing up cash and warehouse space by eliminating unprofitable, slow-moving products. |
| Strategic Promotions | Excess Stock Reduction | Clearing targeted overstock items by increasing their perceived value and encouraging larger orders. |
| Supplier Collaboration | Inventory Holding Costs | Reducing the amount of on-hand inventory by negotiating better terms and improving order frequency. |
Improving your inventory turnover is not about a single solution but about building a more responsive and data-driven operation, from purchasing to pricing.
Using Competitive Intelligence to Optimize Your Stock
Inventory decisions made in a vacuum are inherently flawed. Relying solely on your own sales history provides an incomplete picture of the market. Competitive intelligence adds the external context needed to make truly strategic decisions.
By monitoring competitor pricing and stock levels, you can shift from a reactive to a proactive inventory management strategy. This data reveals market dynamics that your internal numbers cannot, helping you anticipate demand shifts and make smarter choices that directly improve your inventory turnover.
Turning Competitor Data into Actionable Insights
This is about identifying clear, commercially valuable signals in the market. For example, if a key competitor goes out of stock on a popular product, this is an immediate opportunity. It indicates strong market demand and a reduction in supply.
Your response should be swift:
- Assess your own stock levels for that product and its close alternatives to prepare for increased demand.
- Review your pricing. With reduced competition, there may be an opportunity to adjust your price to improve margins.
- Alert your marketing team. There is now a motivated audience of buyers actively seeking a new supplier.
The reverse is also true. If you see competitors aggressively discounting an entire product category, it could signal market saturation or waning consumer interest. This is a warning to delay reordering and avoid being left with unwanted stock. To learn more, read our guide on effective competitive intelligence gathering.
Benchmarking Against Industry Leaders
To understand what peak efficiency looks like, consider the transportation and logistics industry. These companies operate on extremely thin margins and have some of the highest turnover ratios because their business model depends on it. This focus on efficiency is now critical for all B2B distributors and online retailers.
When you use a platform for competitor tracking, you are not just gathering data—you are benchmarking your operational speed against the market. This gives you a clear measure of your own performance. For more on this, you can discover more insights on how inventory turnover benchmarks vary by industry.
By monitoring competitor stock levels, you’re not just tracking inventory; you’re tracking market opportunities. A competitor’s low stock is your high demand signal.
Manual monitoring is no longer feasible in a dynamic market. Automated tools are essential for providing the near real-time data needed to make rapid purchasing and pricing decisions that protect profits and maintain inventory velocity.
Your Inventory Turnover Optimization Checklist
You understand the concepts. Now, it's time for execution. This checklist provides a practical, step-by-step roadmap for systematically improving your inventory turnover and, by extension, your profitability.
It is structured as a phased approach, starting with data fundamentals and progressing to strategic actions.

Phase 1: Building a Solid Data Foundation
Effective optimization begins with accurate data. Any action taken without a solid data foundation is guesswork.
- Schedule the Calculation: Set a recurring calendar event to calculate your inventory turnover ratio, either monthly or quarterly. Consistency is crucial for identifying trends before they become significant problems.
- Verify Your Inputs: Double-check your Cost of Goods Sold (COGS) and Average Inventory figures from your accounting or ERP system. Ensure the data is accurate, as flawed inputs produce flawed outputs.
- Segment Your Inventory: Analyze turnover by product category, brand, or supplier. A single, company-wide ratio can mask problems within specific segments.
Phase 2: From Data to Discovery
With clean and organized data, you can begin to identify the root causes of inefficiency. This phase is about pinpointing the specific products that are hindering your performance.
- Identify Your 10 Slowest-Moving SKUs: Run a report on products with the lowest sales velocity over the last six months. These are your primary targets for action.
- Calculate the True Cost: Determine the actual holding costs (storage, insurance, tied-up capital) for these slow-moving products. Quantifying this cost in dollar terms builds a strong business case for liquidation or promotion.
- Benchmark Your Performance: Compare your ratio against industry benchmarks. This will help you determine if your turnover issues are specific to your business or part of a broader market trend.
A checklist isn't just a to-do list; it's a commitment to a process. Consistently completing these small steps leads to significant improvements in how efficiently your capital works for you.
Phase 3: Taking Action and Staying Sharp
This is the implementation phase. Based on your analysis, it's time to make targeted changes and establish a system for continuous improvement.
- Run a Dynamic Pricing Test: Select five slow-moving products and experiment with a small, data-informed price reduction to stimulate sales.
- Set Up Competitor Stock Alerts: Use a monitoring tool to notify you when competitors go out of stock on your top five products. Their supply issue is your market opportunity. This is where a platform like Market Edge provides the real-time data needed to capitalize instantly.
- Conduct a Quarterly Purchasing Review: Meet with your purchasing team to review your findings. Use the data to refine demand forecasting and adjust reorder points to prevent future overstock situations.
Got Questions About Inventory Turnover? Let's Clear Things Up.
Even for seasoned managers, practical questions about inventory turnover often arise. Here are answers to some of the most common inquiries from ecommerce leaders.
Inventory Turnover vs. DSI: What's the Real Difference?
These two metrics are related but measure different aspects of inventory performance. One measures frequency, while the other measures duration.
Inventory turnover ratio measures frequency. It answers, "How many times did we sell and replace our entire stock this year?" A ratio of 6 means the full inventory was turned over six times.
Days Sales of Inventory (DSI) measures duration. It answers, "On average, how many days does a product sit on our shelves before being sold?" It is calculated by dividing 365 by the turnover ratio. A turnover of 6 corresponds to a DSI of approximately 61 days.
In short, turnover indicates the rate of sale, while DSI provides the duration of holding.
How Often Should I Actually Calculate My Inventory Ratio?
The optimal frequency depends on your business's pace. The general rule is to match your calculation frequency to your operational tempo.
- Monthly: For fast-paced industries like consumer electronics or fashion, monthly calculation is essential. Market conditions change rapidly, and monthly data allows for quick reactions to avoid being left with obsolete stock.
- Quarterly: For businesses with longer sales cycles, such as those selling furniture or specialized industrial equipment, a quarterly review is typically sufficient. It provides a clear view of performance trends without excessive administrative burden.
Is It Possible for a High Inventory Turnover to Be a Bad Thing?
Yes. An excessively high turnover ratio can be a sign of underlying problems, despite appearing positive on the surface. While it suggests strong sales, it can also indicate that inventory levels are too low.
An unusually high turnover might mean you're under-buying and constantly on the verge of a stockout. You might be celebrating quick sales, but you're bleeding revenue every time a customer clicks away because the item they want is gone.
Furthermore, a very high ratio can increase operational costs. Maintaining such a pace often requires smaller, more frequent orders, which can lead to higher shipping fees, missed bulk discounts, and increased administrative workload—all of which erode profit margins.
This is where automated price monitoring tools like Market Edge become useful. By providing a real-time view of competitor pricing and stock levels, it helps you find the optimal balance—maintaining a healthy turnover that meets customer demand without sacrificing profitability. You can see how Market Edge works for yourself.