The Cost of Goods Sold (COGS) represents the direct costs incurred to produce the goods sold by a business. For B2B decision-makers, understanding and managing COGS is not just an accounting function; it's a critical component of financial strategy that directly impacts profitability, pricing, and competitive positioning.
COGS separates revenue from gross profit, providing a clear baseline for every pricing decision. Without a precise calculation of COGS, a business cannot accurately determine product margins, making it impossible to build a sustainable pricing model.
What Is Cost of Goods Sold Explained for Business Leaders

For a founder, ecommerce manager, or sales leader, COGS is the cost of inventory. It includes all expenses directly tied to making a product ready for sale, from raw materials and direct labor to the shipping costs required to get those items to your warehouse.
Consider an ecommerce brand selling high-performance outerwear. The COGS for a jacket would include the cost of the waterproof fabric, zippers, and the wages paid to the factory workers who assemble it. It would not include the marketing team's salaries or the rent for the corporate office. Those are operating expenses, not direct costs of producing the goods. Understanding this distinction is fundamental to measuring true product profitability.
What Is Included in COGS
To calculate COGS accurately, you must isolate direct costs from indirect operational expenses. Direct costs are those expenses directly attributable to the creation or acquisition of your products.
A standard COGS calculation includes:
- Raw Materials: The component parts used to manufacture your products.
- Direct Labor: Wages for production staff who physically assemble or create the goods.
- Factory Overhead: Costs directly related to the manufacturing facility, such as utilities for the plant or production supplies.
- Freight-In Costs: Shipping and handling fees paid to transport materials or finished goods from a supplier to your facility.
- Purchase Costs: For resellers and distributors, this is the price paid for finished goods acquired from a manufacturer.
What Is Excluded from COGS
Equally important is knowing which costs to exclude. These expenses are typically categorized as Operating Expenses (OPEX) or Selling, General, and Administrative (SG&A) expenses. They are necessary for running the business but are not tied to the production of a specific unit.
A common pitfall is lumping general business expenses into COGS. This mistake distorts your gross profit margin, making it impossible to gauge true product profitability and leading to flawed, unsustainable pricing.
The following costs should always be kept separate:
- Marketing and Advertising: Expenses incurred to promote your brand and drive sales.
- Sales Commissions: Compensation for your sales team.
- Administrative Salaries: Wages for executive, HR, and accounting staff.
- Rent and Utilities: For corporate offices or retail locations not involved in production.
- Distribution Costs: The expense of shipping the final product to the customer (often called freight-out).
This table clarifies the difference between direct costs (COGS) and indirect operating expenses.
COGS vs. Operating Expenses (OPEX)
This table separates the direct costs included in COGS from the indirect costs of running a business, enabling a clearer analysis of profitability.
| Expense Type | Included in COGS? | Example |
|---|---|---|
| Raw Materials | Yes | Steel for car manufacturing, fabric for clothing. |
| Direct Labor Wages | Yes | Salary for an assembly line worker. |
| Freight-In | Yes | Shipping costs to receive inventory from a supplier. |
| Office Rent | No | Monthly rent for corporate headquarters. |
| Marketing Budget | No | Cost of running a Google Ads campaign. |
| Sales Team Salaries | No | Base salary and commissions for sales reps. |
| Freight-Out | No | Cost to ship a finished product to a customer. |
Mastering this distinction is the first step toward building a resilient pricing strategy that protects margins. Your COGS establishes the price floor; it is the absolute minimum you must exceed to ensure every sale is profitable.
How to Calculate Cost of Goods Sold Accurately
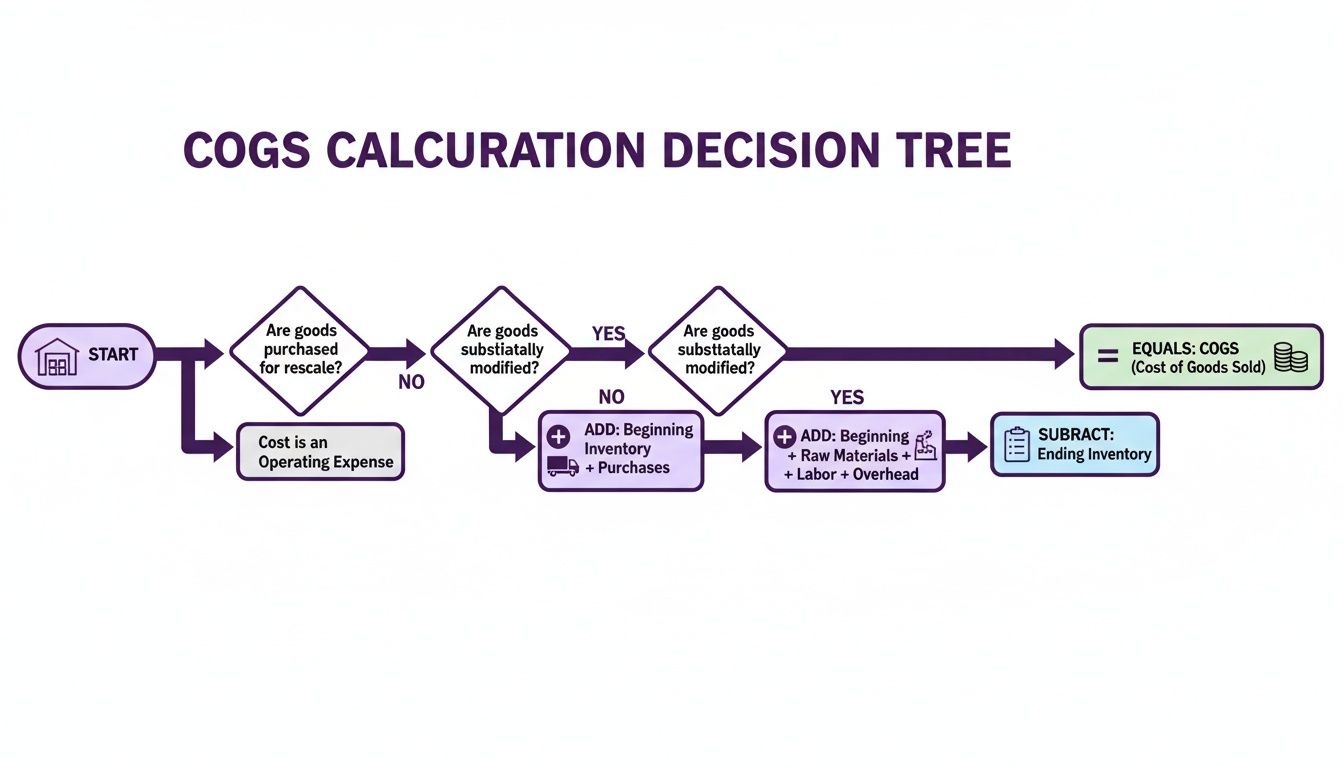
Calculating your Cost of Goods Sold is a straightforward process once you understand the components of inventory flow. The standard formula applies whether you are calculating COGS for a month, a quarter, or a full year.
The formula is:
Beginning Inventory + Purchases – Ending Inventory = Cost of Goods Sold
This formula tracks the movement of inventory value. You start with a certain value of inventory, add the value of new purchases, and subtract the value of what remains. The result is the cost of the inventory that was sold. This figure is critical for the income statement, as it is the primary deduction from revenue to determine gross profit.
Let's break down each component for practical application.
Understanding the COGS Formula Components
An accurate COGS calculation depends on the precise definition of each variable in the formula. Errors in any of these components will distort your financial statements and can lead to poor pricing and procurement decisions.
-
Beginning Inventory: The value of all inventory on hand at the start of the accounting period. This number is identical to the Ending Inventory from the previous period. For example, the inventory value on January 1st serves as the beginning inventory for the first quarter.
-
Purchases: This includes all costs incurred to acquire new inventory during the period. This is not limited to the product's purchase price. It must also include other direct acquisition costs like freight-in (shipping from your supplier), import duties, and raw materials for manufacturers.
-
Ending Inventory: The value of all goods that were not sold by the end of the accounting period. This is typically determined through a physical inventory count or a perpetual inventory management system.
A Practical Calculation Example
Let's apply this formula to a real-world scenario. Assume you are an ecommerce distributor calculating COGS for the second quarter (April 1 to June 30).
-
Step 1: Determine Beginning Inventory. On April 1, your records show you had $150,000 worth of products in your warehouse.
-
Step 2: Calculate Total Purchases. Over the quarter, you acquired new inventory. The total cost of these products, including shipping and import fees, was $80,000.
-
Step 3: Determine Ending Inventory. On June 30, a physical stock count reveals you have $110,000 worth of unsold goods remaining.
Now, apply the formula:
$150,000 (Beginning Inventory) + $80,000 (Purchases) – $110,000 (Ending Inventory) = $120,000 (COGS)
Your Cost of Goods Sold for Q2 is $120,000. This is the direct cost associated with the products sold to customers during that period.
With this number, you can calculate your gross profit. If total revenue for the quarter was $200,000, your gross profit is $80,000 ($200,000 Revenue - $120,000 COGS). To take the analysis further, see our guide on how to calculate profit margin to understand its impact on overall financial health.
Choosing Your Inventory Valuation Method
Calculating your Cost of Goods Sold involves a critical strategic decision: the inventory valuation method. This choice directly impacts your reported COGS and gross profit, particularly when your procurement costs fluctuate.
This decision is more relevant than ever. With global trade dynamics constantly shifting, as highlighted by UNCTAD's Global Trade Update, input costs can be highly volatile. Your accounting method determines how these price shifts are reflected on your income statement.
Why Your Valuation Method Matters Commercially
Imagine your company purchases the same component three times during a quarter at increasing prices: $10, then $12, and finally $15. If you sell two units, which costs do you assign to those sales? The first two ($10 and $12)? Or the most recent two ($12 and $15)? Your choice changes your COGS from $22 to $27, directly impacting your reported profit margin.
Your inventory valuation method provides the rulebook for assigning these costs. The flowchart below illustrates how this decision is a core element of the COGS calculation.
There are three primary inventory costing methods, each providing a different perspective on your company's financial performance.
The Three Main Inventory Costing Methods
1. First-In, First-Out (FIFO)
The FIFO method assumes the first inventory items purchased are the first ones sold. This method often aligns with the physical flow of goods, especially for businesses dealing with perishable products or technology with short life cycles.
During periods of rising prices, FIFO results in a lower COGS because older, less expensive inventory costs are matched against current revenues. This leads to a higher reported gross profit.
2. Last-In, First-Out (LIFO)
The LIFO method assumes the last inventory items purchased are the first ones sold. While this may not reflect the physical movement of inventory, it offers a significant advantage during inflationary periods.
By matching the most recent—and thus most expensive—costs against revenue, LIFO increases the reported COGS. This reduces reported profit, which can result in a lower tax liability. However, LIFO is not permitted under International Financial Reporting Standards (IFRS), limiting its use primarily to the United States.
3. Weighted Average Cost (WAC)
The Weighted Average Cost method provides a blended approach. It smooths out cost fluctuations by calculating a single average cost for all identical items in inventory.
This average is calculated by dividing the total cost of all goods available for sale by the total number of units. This blended cost is then used to value both COGS and ending inventory. It is a balanced method that avoids the profit swings associated with FIFO and LIFO.
This table compares how each method performs in an environment of rising costs.
Comparing Inventory Costing Methods
| Method | Impact on COGS in Rising Prices | Impact on Gross Profit in Rising Prices | Best For |
|---|---|---|---|
| FIFO | Lower COGS | Higher Gross Profit | Businesses where inventory flow is sequential (e.g., food, electronics) or for presenting stronger profitability to investors. |
| LIFO | Higher COGS | Lower Gross Profit | U.S.-based businesses seeking tax advantages during periods of inflation. Not permitted under IFRS. |
| Weighted Average | Moderate COGS | Moderate Gross Profit | Businesses with non-perishable, identical items where tracking individual costs is impractical. Provides a stable, middle-ground view. |
The choice between FIFO, LIFO, and WAC is a strategic one that affects tax liability and the perception of your company's profitability among investors and lenders. The decision should align with your business's operational reality and financial goals.
How Global Trade and Tariffs Impact Your COGS
Your Cost of Goods Sold is directly exposed to global economic forces. For any business sourcing materials, manufacturing overseas, or importing products, factors like shipping bottlenecks, freight costs, and international tariffs directly impact the "Purchases" component of the COGS formula. These are not abstract economic indicators; they are hard costs that inflate your inventory value.
When a new tariff is imposed on imported goods, that cost is added directly to your purchase price. This volatility requires constant cost monitoring and agile pricing strategies. If you fail to track and react to these increases, your business absorbs the cost, and your gross profit margin erodes with every inbound shipment.
The Real-World Impact of Tariffs on Your Bottom Line
Consider a distributor of electronic components sourced from Asia. A new 10% tariff on microchips instantly increases the cost of acquiring that inventory. That increase must be factored into your COGS, which in turn compresses the gross profit margin on every product containing that component.
This is not a hypothetical scenario. According to Yale's analysis on the short-run effects of recent tariffs, recent trade policies have created significant cost pressures. For instance, recent tariffs have already pushed core goods prices 1.9% higher than they would have been otherwise, with prices for imported durable goods increasing by 12.4% in the first half of the year alone. This is a direct impact on the COGS for thousands of importers and retailers.
In an unpredictable global market, COGS is a moving target. Failing to monitor how external factors like tariffs and freight costs affect your purchase prices is one of the fastest ways to lose control of your profitability.
Protecting Your Margins When Costs Are Rising
When external forces inflate your COGS, you have three primary strategic responses:
- Supplier Negotiation: Re-evaluate terms with existing suppliers. Explore options for locking in pricing or identify alternative suppliers to mitigate cost increases.
- Operational Efficiency: Identify opportunities for cost savings within your control. Reduce waste, optimize internal handling processes, or improve inventory management to offset higher procurement costs.
- Pricing Strategy Adjustment: This is the most critical response. You must determine when and by how much to raise your prices to protect margins without alienating customers. A real-world example is MAP (Minimum Advertised Price) enforcement. When COGS rise, ensuring all retail partners adhere to MAP policies prevents price wars that would further erode already shrinking margins.
This is where automated solutions become essential for maintaining a competitive edge. For example, a price monitoring tool like Market Edge provides real-time visibility into how competitors are responding to the same cost pressures. This market intelligence enables data-driven pricing decisions that protect your bottom line.
Using COGS to Build a Smarter Pricing Strategy
A precise understanding of your Cost of Goods Sold is the foundation of a durable pricing model. Your COGS establishes your absolute price floor—the break-even point for every product you sell. Pricing below this floor means you lose money on every transaction.
Without this baseline, pricing becomes guesswork. Prices may appear competitive, but you could be leaking margin on every sale. Understanding your COGS for each SKU is the first step toward making intentional, profit-driven pricing decisions. In an ecommerce market projected to reach $7.4 trillion by 2025, intense margin pressure makes cost control a critical differentiator.
From Cost Analysis to Pricing Models
Once you establish a COGS-driven price floor, you can build an intelligent pricing strategy. This foundation is the starting point for nearly every effective pricing model.
- Cost-Plus Pricing: The most direct application. You calculate your COGS and add a predetermined markup (a percentage or a flat fee) to set your final price. This method is straightforward and ensures a consistent gross margin. See our guide for practical cost-plus pricing examples.
- Value-Based Pricing: This model sets prices based on the perceived value to the customer. However, COGS serves as a critical reality check, ensuring that even value-driven prices remain profitable.
- Competitive Pricing: When you set prices based on market competitors, COGS acts as your safety net. It defines how low you can go in a competitive scenario without losing money and helps identify competitors operating on potentially unsustainable margins.
Identifying Your Most Profitable Products
Analyzing COGS on a per-SKU basis allows you to segment your product catalog by profitability. This reveals your high-margin "hero" products and your low-margin items that may be draining resources.
Knowing the precise COGS for each product empowers smarter decisions across inventory management, marketing spend, promotional campaigns, and product lifecycle planning.
With this data, you can allocate marketing resources to promote your most profitable items or create product bundles that pair high-margin products with slower-moving inventory. This transforms COGS from a static accounting figure into a dynamic tool for strategic decision-making.
Actionable Checklist: Integrating COGS into Pricing Reviews
To translate this analysis into action, integrate COGS data into your regular pricing reviews. This checklist helps align your pricing strategy with profitability goals.
- Review COGS per SKU Quarterly: Identify which product costs are increasing and why.
- Update Price Floors: Recalculate the minimum profitable selling price for each product based on the latest COGS data.
- Analyze Gross Margin Trends: Track whether the profitability of key products is improving or declining over time.
- Benchmark Against Competitors: Evaluate how your updated, COGS-aware prices compare to the market.
- Adjust Promotional Strategy: Ensure that discounts, bundles, and other promotions do not push prices below your established price floor.
Protecting Your Margins with Competitive Price Monitoring
Your Cost of Goods Sold defines your price floor—the minimum price required to break even on a sale. However, your internal costs are only half of the pricing equation. The competitive market dictates your price ceiling—the maximum price customers are willing to pay.
Effective pricing strategy exists in the space between your COGS and the market ceiling. When supply chain disruptions or rising material costs inflate your COGS, maintaining static pricing can eliminate your profit. Conversely, increasing prices without understanding the competitive landscape can drive customers to your rivals.
Bridging Internal Costs with External Market Data
To navigate this challenge, businesses need a continuous stream of competitive intelligence. Knowing how rivals are pricing their products allows you to make strategic price adjustments that protect your gross margin without sacrificing market share.
For example, if automated competitor tracking reveals that multiple competitors are raising prices on a key product line, it often signals a market-wide cost increase. This provides the context and cover to adjust your own prices without appearing as an outlier. This is a practical, data-driven approach to margin protection. For more on this, see our guide on how to monitor competitor prices.
The Role of Automated Competitor Tracking
Manual competitor price checks are inefficient, prone to error, and provide an outdated snapshot of the market. Automated competitor tracking platforms are now a core component of modern pricing strategy, creating an essential data bridge between your internal COGS and external market dynamics.
By continuously monitoring the market, you can align your pricing with both your internal cost structure and external competitive pressures, ensuring every pricing decision is both profitable and competitive.
These systems provide actionable intelligence through a clear, vendor-neutral workflow:
- Data Aggregation: They systematically crawl and collect price and stock information from thousands of ecommerce sites, marketplaces, and direct competitors.
- Product Matching: Advanced algorithms accurately match your products to competitors' offerings, even with variations in naming conventions or product descriptions.
- Actionable Insights: The platform delivers structured data through dashboards and alerts, providing a clear view of your competitive positioning in near real-time.
This automated intelligence enables your team to react swiftly to market shifts. It is also a critical tool for MAP (Minimum Advertised Price) enforcement, ensuring retail partners do not devalue your brand and erode margins across the board. When your COGS are rising, this level of control is a necessity. This is where automated price monitoring tools like Market Edge become useful.
Market Edge provides the competitive intelligence needed to price with confidence. To see how real-time price monitoring can protect your margins and grow your business, visit https://marketedgemonitoring.com.