When you hear "big data in retailing," don't just think about massive spreadsheets. Think of it as the disciplined process of gathering vast, unstructured information from across the market and converting it into profitable business decisions. It’s about looking beyond your own sales numbers to pull in data from competitors, suppliers, and customer behavior. This process turns raw information into a high-value strategic asset.
Why Big Data Is a Core Commercial Asset

For ecommerce managers, brand leaders, and pricing teams, big data is no longer a technical buzzword—it's the engine of modern commerce. Raw business data is like crude oil: in its natural state, it's messy and has limited use. But once refined through analytics, it becomes the high-octane fuel that powers growth, efficiency, and a significant competitive advantage.
In a crowded market, relying on historical sales reports or intuition is a formula for being outmaneuvered. Competitors adjust prices hourly, supply chains face constant disruption, and customer demand shifts rapidly. To stay ahead, you must tap into data from every corner of the market—from a supplier’s inventory levels to a rival's pricing on Amazon.
From Guesswork to Strategic Decisions
The commercial value of big data lies in its power to replace guesswork with evidence. Instead of reacting after a competitor slashes prices, you can anticipate market shifts and act proactively. This approach protects profit margins, grows market share, and improves operational efficiency.
This strategic shift is well underway. The global big data analytics in retail market is projected to reach USD 12.68 billion by 2031, signaling that business leaders are fully invested in data-driven strategy. You can explore the full retail analytics market growth forecast to see the speed of this adoption.
Here are a few real-world examples of this in action:
- Price Monitoring for Margin Protection: A distributor moves beyond a simple "cost-plus" model by analyzing real-time competitor data. This allows them to identify the optimal price point—the highest price they can set without sacrificing sales volume.
- MAP/RRP Enforcement for Brand Value: A brand can automatically monitor thousands of online sellers to ensure compliance with its pricing policies. This protects brand equity and maintains fair competition among retail partners.
- Competitor Tracking for Inventory Optimization: By observing that a key competitor is low on stock for a popular item, a retailer can anticipate a market shortage, adjust its own inventory, and modify pricing to capture the resulting demand.
Before diving deeper, let's summarize how big data transforms core retail functions.
Key Retail Areas Transformed by Big Data
This table illustrates the contrast between operating on intuition versus data-backed intelligence.
| Business Function | Traditional Approach (Guesswork) | Big Data Approach (Data-Driven) |
|---|---|---|
| Pricing | Based on cost, gut feel, or last year's prices. | Dynamic pricing based on competitor moves, demand signals, and inventory. |
| Inventory Management | Ordering based on historical sales and seasonal forecasts. | Predicting demand using real-time trends, competitor stock, and market signals. |
| Personalization | Generic marketing promotions sent to everyone. | Highly specific offers and recommendations based on individual browsing history. |
| Assortment Planning | Stocking products based on supplier catalogs and past bestsellers. | Curating products based on market gaps, search trends, and competitor analysis. |
| Supply Chain | Reactive adjustments to delays and disruptions. | Proactive rerouting and planning based on predictive risk modeling. |
It's a fundamental move from operating with an incomplete view to making every decision with a clear, comprehensive picture of the market. This integrated intelligence allows you to answer critical business questions with confidence: Are we priced correctly on our most important products? Which competitor poses the greatest threat to our market share? Are our retail partners adhering to our pricing policies?
Answering these questions requires clean, reliable, and up-to-the-minute data. This is where automated price monitoring tools, such as Market Edge, become essential for performing the necessary data collection and analysis at scale.
Core Applications for Retail Success

Applying big data to solve concrete business challenges is where its value becomes clear. For retail leaders, the goal is to use data to address everyday issues like protecting margins, maintaining stock availability, and outmaneuvering competitors.
Using big data in retail facilitates a shift from a reactive to a proactive stance. Instead of merely responding to market events, you begin to anticipate and even shape them. This provides a clear, data-backed advantage in several critical areas.
Dynamic Pricing and Price Monitoring
The static "set it and forget it" pricing model is obsolete in modern ecommerce. Dynamic pricing uses a continuous stream of data—competitor prices, demand signals, inventory levels, and seasonality—to make intelligent, automated price adjustments. The objective is to remain competitive without sacrificing profit margins.
Effective price monitoring is not just about lowering prices. It reveals opportunities to increase prices, such as when a competitor goes out of stock or market demand surges. For a deeper look at the technology involved, see how machine learning for retail powers these sophisticated pricing strategies.
Mini Use Case: A Distributor's Margin Protection A B2B distributor of electronic components was using a standard cost-plus pricing formula. After implementing an automated price monitoring solution, they discovered that 20% of their key products were priced significantly below the market average. By methodically raising prices on these items to a competitive level, they immediately increased their gross margin without impacting sales volume.
Inventory and Assortment Optimization
Overstocking ties up capital, while understocking leads to lost sales and frustrated customers. Big data helps manage this balance. By analyzing historical sales data alongside real-time market signals—trends, competitor stock levels, and even social media activity—you can forecast demand with high accuracy.
This transforms inventory management into a data-driven discipline, providing clear answers to critical questions:
- What to stock: Identify gaps in the market or capitalize on products your competitors struggle to keep in stock.
- When to stock: Accurately forecast seasonal demand to avoid holding excess inventory.
- Where to stock: For multi-location businesses, allocate inventory to where it is most likely to sell.
MAP and RRP Enforcement
For brands, ensuring resellers adhere to pricing policies is a significant operational challenge. Unauthorized discounting devalues your brand, creates channel conflict, and erodes your products' perceived value. Manually monitoring hundreds of websites for Minimum Advertised Price (MAP) or Recommended Retail Price (RRP) violations is not feasible.
Automated tools are designed to solve this problem. They can monitor thousands of product pages across websites and marketplaces daily, instantly flagging policy violations. This provides your team with the necessary evidence, such as screenshots and timestamps, to enforce compliance efficiently.
Vendor-neutral platforms for ecommerce and marketplace monitoring are built for this purpose, enabling you to enforce pricing policies across the digital shelf without manual effort. A solution like Market Edge is one example of a tool designed for this workflow.
Competitor Tracking and Intelligence
Beyond pricing, big data enables comprehensive monitoring of your competitors' activities. Systematically tracking their online presence provides the intelligence needed to develop a winning strategy.
Key data points to track include:
- Stock Availability: A competitor's stockout on a popular item is an opportunity to capture their customers.
- Promotional Activity: Monitor sales, bundles, and special offers to understand their promotional strategy and respond effectively.
- Assortment Changes: Note when they add new products or brands, as this often signals their strategic direction.
- Customer Reviews: Analyze their reviews to identify weaknesses in their products or services that you can leverage.
Mini Use Case: A Brand's Competitive Edge An ecommerce brand selling outdoor gear used competitor tracking to monitor a rival's stock of a top-selling jacket. The data revealed that the competitor was nearly sold out. The brand immediately launched a targeted ad campaign for its comparable jacket, highlighting its availability. This resulted in a 15% sales increase for that product in two weeks.
Your Retail Big Data Implementation Roadmap
Implementing a big data strategy can seem complex, but it becomes manageable when broken down into a logical, step-by-step process. This roadmap focuses on business outcomes rather than technical jargon, providing a clear path from raw data to automated, intelligent actions.
Stage 1: Sourcing and Collecting Data
The first step is gathering the necessary raw materials. While your internal data (sales history, inventory levels) is a valuable starting point, a complete market view requires external data.
Systematically collect information from:
- Competitor Websites: Track product prices, stock levels, and promotions directly from their ecommerce stores.
- Online Marketplaces: Monitor your products and competitor listings on major platforms like Amazon and eBay.
- Reseller Sites: For brands, this involves monitoring how retail partners price and present your products.
Continuous, automated data collection is crucial. Specialized tools use web crawlers to gather this data reliably and at scale, forming the foundation of your strategy.
Stage 2: Cleaning and Preparing Data
Raw data from the web is inherently messy, containing inconsistencies, formatting errors, and missing details. Before analysis, this data must be cleaned and structured in a process known as data wrangling.
This stage involves standardizing product names, removing duplicates, and filling gaps to ensure your analysis is accurate and reliable.
A significant portion of any data project is dedicated to this cleaning and structuring phase. It is a critical, non-negotiable step for generating trustworthy insights.
Stage 3: AI-Based Product Matching
Once data is clean, the next challenge is matching your products to competitors' listings. Manual matching is impractical for large catalogs, as competitors may use different names, images, or product codes for the same item.
AI-powered systems automate this process. They use algorithms to analyze product titles, descriptions, images, and identifiers (EANs, UPCs) to accurately match products across the web. This product matching is the linchpin of competitive intelligence, transforming disconnected data points into a clear map of the market.
Stage 4: Generating Actionable Insights
With clean, matched data, you can move from collection to analysis. The goal is to create dashboards and reports that highlight opportunities and threats without requiring manual data exploration.
This means translating raw data into clear, actionable insights, such as:
- A list of all SKUs where you are priced 10% higher than a key competitor.
- An alert when a rival runs out of stock on a best-selling item.
- A report identifying resellers violating your MAP policy, with documented proof.
This stage is about converting complex data into simple takeaways that your team can act on immediately.
Stage 5: Taking Automated Action
The final stage is where your data strategy delivers a direct return. Based on the insights generated, you can establish automated rules and workflows that respond to market changes in near real-time.
Practical examples include:
- Pricing Rules: Automatically adjust your price to remain 2% below a specific competitor, while ensuring it never drops below your minimum profit margin.
- MAP Violation Alerts: When a reseller's price falls below your MAP, an automated alert with evidence is sent to your enforcement team.
- Stock Alerts: Notify your purchasing team when a competitor's low stock signals a potential market shortage, allowing you to secure inventory proactively.
This creates a closed-loop system where market intelligence actively drives smarter, more profitable decisions. This is where automated price monitoring tools, like Market Edge, are particularly effective.
Optimizing Your Supply Chain with Data and AI
For manufacturers and distributors, the supply chain is a balance between minimizing costs and ensuring customer satisfaction. Traditionally, this has been a reactive process. Big data and AI transform the supply chain from a cost center into a proactive, strategic asset.
Instead of just reacting to disruptions, you can predict them. Predictive analytics allows for highly accurate demand forecasting by analyzing real-time market signals, competitor stock levels, and emerging trends. This data-backed approach reduces the guesswork in inventory planning.
This directly impacts your bottom line by addressing two major sources of financial drain: overstocking and stockouts. Excess inventory ties up capital, while stockouts result in lost sales. A data-informed supply chain helps you maintain an optimal inventory balance.
From Reactive Fixes to Predictive Planning
The business case for an intelligent supply chain is compelling. It creates a significant competitive advantage. For example, when competitor monitoring reveals that a rival is out of stock on a key product, you can immediately adjust your pricing or launch a promotion to capture that unmet demand.
This is why adoption is accelerating. Currently, 30% of retailers use AI for supply chain visibility, with that number expected to rise to 41% within a year. Furthermore, 59% of retail executives anticipate a positive ROI on these initiatives within 12 months. You can see more findings on AI-driven supply chain strategies and their impact on profitability.
Key AI Applications in Supply Chain Management
Here are practical applications of AI and big data in supply chain operations:
- Predictive Demand Forecasting: AI analyzes historical sales data alongside external factors like holidays, weather, and social media trends to build accurate demand models. This improves ordering precision. To understand its financial impact, see our guide on the inventory turnover ratio.
- Logistics Optimization: Algorithms can determine the most efficient shipping routes by considering real-time traffic, fuel costs, and delivery schedules, leading to lower transportation expenses and improved delivery times.
- Supplier Risk Management: AI can monitor suppliers for early warning signs of disruption, such as financial instability or regional issues, giving you time to secure alternative sources before your inventory is affected.
Transforming raw market data into these strategic supply chain actions is a structured process. The flowchart below outlines the five core stages.
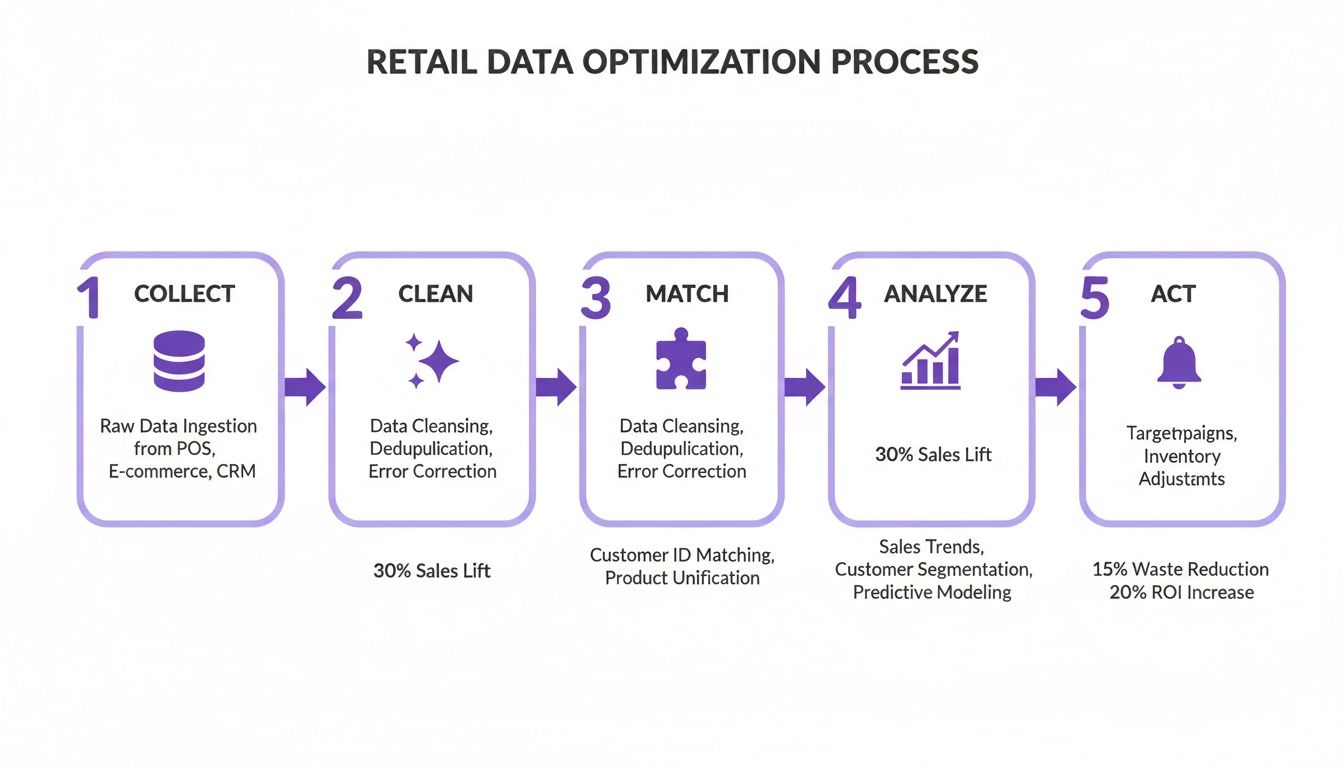
The process moves from raw data collection to cleaning, matching, analysis, and finally, automated action—such as a stock alert or a price change. The goal is to build a supply chain that is both resilient and agile, capable of capitalizing on market disruptions.
Achieving this requires continuous, automated market monitoring. Tools such as Market Edge provide the real-time stock and availability data necessary to power an intelligent supply chain strategy.
Turning Big Data Theory into Action: Your First Steps
The objective for business leaders is not to solve every problem at once, but to identify a high-impact starting point that delivers a clear, measurable win. This checklist provides a practical starting point without requiring a dedicated data science team. It is a diagnostic tool to pinpoint a manageable project that demonstrates the value of big data in retailing.
First, Get a Lay of the Land
Before taking action, you must understand your competitive landscape. Focus on the competitors and products that most impact your bottom line.
- Who are your top 5 direct competitors? List the rivals you compete with daily, including their direct ecommerce sites and marketplace presence.
- What are your 10 most critical SKUs? Focus on the products that are most important to your revenue or brand strategy, such as bestsellers or "hero" products.
- What is the one business question you need an answer to right now? Frame it as a specific, measurable query. For example: "Are we priced competitively on our hero products?" or "Which of our resellers are violating our MAP policy this week?"
The purpose of this initial assessment is to build a focused, high-value dataset that answers a pressing commercial question. Starting small is key to achieving a quick, demonstrable win.
Next, Plan Your First Data-Driven Move
With your targets identified, decide what you will do with the information you gather. This bridges the gap between intelligence and execution.
- Set a clear monitoring goal: Based on your business question, define a desired outcome. For example: "Ensure our top 10 SKUs are always priced within 3% of Competitor X" or "Achieve 95% MAP compliance across our top 20 resellers."
- Define your action trigger: What specific data point will signal it's time to act? This could be a price difference crossing a threshold, a competitor stockout, or a detected MAP violation.
- Decide on your response: When a trigger is activated, what is the next step? This could be automatically adjusting a price, alerting a sales representative to contact a non-compliant reseller, or launching a targeted promotion.
This framework provides a clear path from data collection to business impact.
Attempting to execute this manually is not scalable. This is where tools that automate competitive intelligence gathering, SKU tracking, and trigger alerts become necessary. Platforms like Market Edge are designed to handle these tasks, allowing your team to focus on strategic decision-making.
Measuring Success and Overcoming Common Hurdles
Implementing a big data strategy is an ongoing discipline that requires measurement and adaptation. For business leaders, success is not measured by the volume of data collected, but by its direct impact on the bottom line. Tracking the right key performance indicators (KPIs) is essential to prove ROI.
Your focus must be on tangible business metrics that demonstrate the value of your data initiatives.
Key Performance Indicators to Track
-
Gross Margin Improvement: Are data-informed pricing decisions increasing profit per sale? Track this by product category to identify where your strategy is most effective.
-
Pricing Agility: How quickly can you respond to a competitor's price change? Measure the time from detection to your own price adjustment, with the goal of reducing this from days to minutes.
-
MAP/RRP Violation Rate: For brands, monitor the percentage of resellers complying with your pricing policies. A declining violation rate indicates effective enforcement.
-
Stockout Reduction: Are you experiencing fewer stockouts on popular products? This is a direct indicator of improved demand forecasting and revenue protection.
Navigating Common Challenges
Two common obstacles are poor data quality and "analysis paralysis," where teams are overwhelmed by information and unable to act.
Inaccurate or outdated data leads to flawed decisions. The solution is to use specialized tools with advanced web crawlers and AI-powered matching algorithms designed to handle the complexities of web data.
Analysis paralysis occurs when there is too much data without clear direction. The solution is to start small. Select one specific business question and focus only on the data needed to answer it. Solve one high-value problem at a time.
Effectively using big data in retailing requires a foundation of clean, reliable information. You can learn more about structuring your approach in our complete guide to big data strategies in retail.
This is where automated price monitoring tools like Market Edge become useful. They provide the clean, structured data needed to overcome these challenges, allowing your team to focus on strategy rather than data cleanup.
Still Have Questions About Big Data in Retail?
Here are answers to some of the most common questions we hear from decision-makers.
"I'm a Small Online Retailer. How Can I Afford to Start with Big Data?"
You don't need a large budget to begin. The key is to be strategic. Do not try to analyze your entire catalog against every competitor.
Instead, focus on what matters most. Start by tracking the prices of your top-selling products against a few direct competitors. This provides valuable, actionable insights without a significant initial investment. Using a scalable, automated tool allows you to access this intelligence without building your own infrastructure or hiring a data science team.
"What’s the Real Difference Between Business Intelligence and Big Data?"
These terms are often used interchangeably, but they serve different functions.
A simple distinction:
Business Intelligence (BI) is retrospective. It analyzes your internal, historical data to explain what happened. Examples include last quarter's sales reports or a dashboard showing last week's inventory levels.
Big data, in contrast, is forward-looking. It incorporates vast amounts of external, real-time information to help predict what will happen and determine the best course of action. It is focused on strategy and anticipation.
For instance, BI can tell you how many units you sold in July. Big data in retail can analyze competitor stock levels, current market trends, and live pricing to forecast customer demand for August.
"How Long Until I Actually See Any Results?"
With a focused approach and the right tools, you can achieve tangible results quickly. Setting up automated monitoring is fast, and insights begin to flow almost immediately.
For example, implementing automated price monitoring can uncover margin improvement opportunities or identify MAP violations within the first few days. This means you can see a measurable return on investment, such as protected brand value or increased profitability, in less than a month.
This is where automated price monitoring tools like Market Edge become useful. They deliver the clean, real-time data needed to answer these kinds of questions and make confident decisions. Learn more at marketedgemonitoring.com.