When you hear "big data in retail," what comes to mind? For many business leaders, it sounds like a complex technical problem. In reality, it's a strategic commercial tool—a way of collecting, processing, and analyzing massive datasets to find actionable insights.
This isn't an IT project; it's about making smarter, faster decisions on everything from pricing and inventory to protecting your brand online. It's about turning raw market information into a tangible competitive edge.
What Big Data in Retail Actually Means for Your Business

For B2B decision-makers, "big data" can feel like an intimidating buzzword that screams technical overhead. In practice, its value is purely commercial. It's about answering your most pressing business questions with hard evidence, not intuition.
Think of it as having a constant, live feed of market intelligence. Instead of guessing a competitor’s pricing strategy, you track their adjustments as they happen. And rather than discovering a Minimum Advertised Price (MAP) violation weeks after the fact, you get an alert within hours. This is the core benefit: a fundamental shift from being reactive to proactive.
The market is already voting with its budget. The global big data analytics market in retail hit USD 7.73 billion in 2023 and is on track to reach USD 11.97 billion by 2030, growing at a 9.14% CAGR. That growth sends a clear message: data-driven operations are no longer a "nice-to-have." Read the full research about the retail analytics market to see the trend lines for yourself.
The Shift from Data Points to Strategic Assets
Not long ago, retail data was siloed and backward-looking, relying on monthly sales reports and quarterly reviews. Big data changes the game by pulling together diverse, high-speed information sources to build a real-time picture of the market as it is right now.
This enables a new level of strategic agility and direct action that impacts your bottom line.
-
Price Monitoring: Automatically track competitor prices across thousands of SKUs to spot opportunities for adjusting your own pricing, either to protect margins or win a critical sale.
-
Competitor Tracking: Monitor a rival’s stock levels, promotions, and product assortment to anticipate their next move and capitalize on weaknesses, like an out-of-stock event.
-
MAP/RRP Enforcement: For brands, automated tools can police the market to ensure resellers adhere to your pricing policies, which is essential for protecting brand value and maintaining partner relationships.
Key Takeaway: Big data in retail isn’t about the data itself. It’s about the commercial actions it empowers. The point is to stop analyzing the past and start influencing future outcomes with smart, real-time decisions.
When executed correctly, you're no longer just competing on product or price; you're competing on intelligence. It’s how you protect margins, enforce brand standards, and react to market shifts faster than rivals using manual spreadsheets. This is where automated data collection tools, like Market Edge, provide the clean, structured intelligence needed to power a modern retail strategy.
Core Applications That Drive Revenue and Protect Margins

For brands, manufacturers, and distributors, raw data is a cost center. When applied, it becomes a profit driver.
The real value emerges when data directly fuels decisions that grow revenue, defend margins, and strengthen your market position. This is where we move from abstract ideas to concrete business outcomes, turning market signals—like a competitor’s price drop or a sudden stockout—into immediate, profitable action.
Price Monitoring and Dynamic Pricing
One of the clearest wins from big data is automated price monitoring. Manually checking a handful of competitor prices is a slow, piecemeal approach. A data-driven system, however, can track thousands of your SKUs across countless online stores, giving you a live feed of the entire competitive landscape.
This constant stream of pricing intel is the fuel for dynamic pricing. Instead of setting prices quarterly, you can make surgical adjustments based on what's happening in the market right now. The goal isn’t just to be the cheapest; it's to be the smartest.
- Margin Optimization: A competitor is out of stock? Your data feed should trigger a price increase to capture better margins while demand is high.
- Competitive Positioning: A key rival slashes the price on a bestseller? You can instantly decide whether to match them to hold market share or stand firm to protect profitability.
- Promotional Timing: By analyzing historical pricing data, you can pinpoint the perfect moments to launch promotions for maximum impact without sacrificing unnecessary margin.
This constant recalibration ensures you’re not leaving money on the table. We dive deeper into this in our guide to dynamic pricing strategies for retail leaders.
MAP Enforcement and Brand Value Protection
For any brand or manufacturer, protecting pricing integrity is non-negotiable. When unauthorized sellers ignore your Minimum Advertised Price (MAP) or Recommended Retail Price (RRP) policies, they don't just undercut your partners—they erode your brand’s perceived value.
Trying to police MAP violations manually is a losing battle. Big data automates the process.
By continuously scanning the web for your products, an automated system flags any listing that drops below your MAP policy. This shifts your team from a reactive, whack-a-mole approach to proactive, systematic enforcement.
This is about more than enforcement; it’s about brand equity. Consistent pricing across every channel sends a powerful message of quality and stability, all while creating a level playing field for your retail partners.
Predictive Demand Forecasting
Stockouts cost you sales, and overstocking ties up cash. Predictive analytics uses big data to create accurate demand forecasts by combining historical sales, seasonality, market trends, and even competitor stock levels.
Imagine your system detects that a major competitor ran out of a popular item. That isn't just a data point; it's a window of opportunity. An automated alert can prompt your team to secure more inventory and ramp up marketing for your alternative product to capture that unmet demand.
This shift from looking in the rearview mirror to looking ahead is transforming the industry. The retail digital transformation market is projected to reach $243.57 million by 2033, growing at a 17.32% CAGR, largely driven by retailers using analytics for smarter inventory management. You can explore more insights on the retail digital transformation market to see the financial impact.
These applications show how big data in retail translates directly into a competitive edge. This is where platforms like Market Edge come in. They do the heavy lifting of collecting and analyzing complex data, delivering the actionable insights you need to make these revenue-generating strategies a reality.
Building Your Retail Data Technology Stack
You don't need a massive team of in-house engineers to build a retail data strategy. The key is assembling the right components—thinking of it as a "technology stack" makes the process much less intimidating. It breaks everything down into logical, manageable layers.
Each layer has a specific job, and they all work together to turn raw market information into a strategic asset. Understanding this flow puts you in control, letting you focus on business outcomes, not technical details.
The Data Collection Layer
This is where it all starts. This layer gathers the raw data you'll need for analysis. Think of it as an army of automated web crawlers and APIs systematically pulling information from competitor websites, online marketplaces, and other digital storefronts.
What is it grabbing?
- Competitor Pricing: Real-time prices for your key products.
- Stock Availability: Is a competitor's product in-stock, low, or sold out?
- Promotional Data: Information on any sales or special offers.
This is the domain of specialized data collection services. A platform like Market Edge, for example, handles the heavy lifting of building and maintaining these sophisticated crawlers, ensuring you get a reliable stream of market data without building the infrastructure yourself.
The Data Processing Layer
Raw data from the web is messy and unstructured. One retailer might list a product as "Nike Air Max 270 Men's Size 10" while another calls it "Men's Nike Air Max 270 (Black/White) - 10." This processing layer cleans, standardizes, and matches that chaotic data.
If you skip this step, your analytics are useless. You'd be comparing apples to oranges, leading to poor pricing decisions. Modern systems use a mix of rules and AI-powered algorithms to achieve accurate product matching, figuring out that your SKU is the exact same product on a competitor’s site, no matter how they’ve named it.
Getting this right is arguably the most crucial part of the entire stack. Our guide on choosing the right pricing analytics software dives deeper into how to evaluate this capability.
The Analytics and Visualization Layer
With clean, structured data, this final layer turns it into intelligence you can use. This is where raw numbers become strategic insights, presented in a way your commercial teams can immediately understand and act on.
This layer usually includes:
- An Analytics Engine: The system that spots trends and flags important events (like a MAP violation or a competitor stockout).
- Business Intelligence (BI) Dashboards: Visual tools—charts, graphs, and tables—that display your key performance indicators (KPIs).
- Alerting Systems: Automated emails or notifications that ping your team about critical events needing immediate attention.
Investment in this area is exploding. Spending on artificial intelligence in retail is projected to climb from $5 billion to over $31 billion by 2028. Much of that money is going directly into making analytics and decision-making smarter. You can learn more about AI trends in retail to see how significant this shift is.
Ultimately, a well-built technology stack ensures your team spends its time on high-value strategic decisions, not wrestling with spreadsheets and manual data entry.
Your Step-By-Step Implementation Roadmap
Jumping from a data strategy on paper to a real-world project can feel daunting. Many retail data initiatives fizzle out, not because the tech is wrong, but because the initial scope is too big. The key is a disciplined, phased approach that delivers business value—fast.
Forget trying to solve every problem at once. De-risk the process by starting small. Pick one high-impact business challenge, prove the ROI with a pilot project, and then scale up based on that success. This roadmap helps build momentum and internal buy-in.
The technical journey can be broken down into three core stages: gathering raw data, cleaning it for accuracy, and turning it into actionable insights.
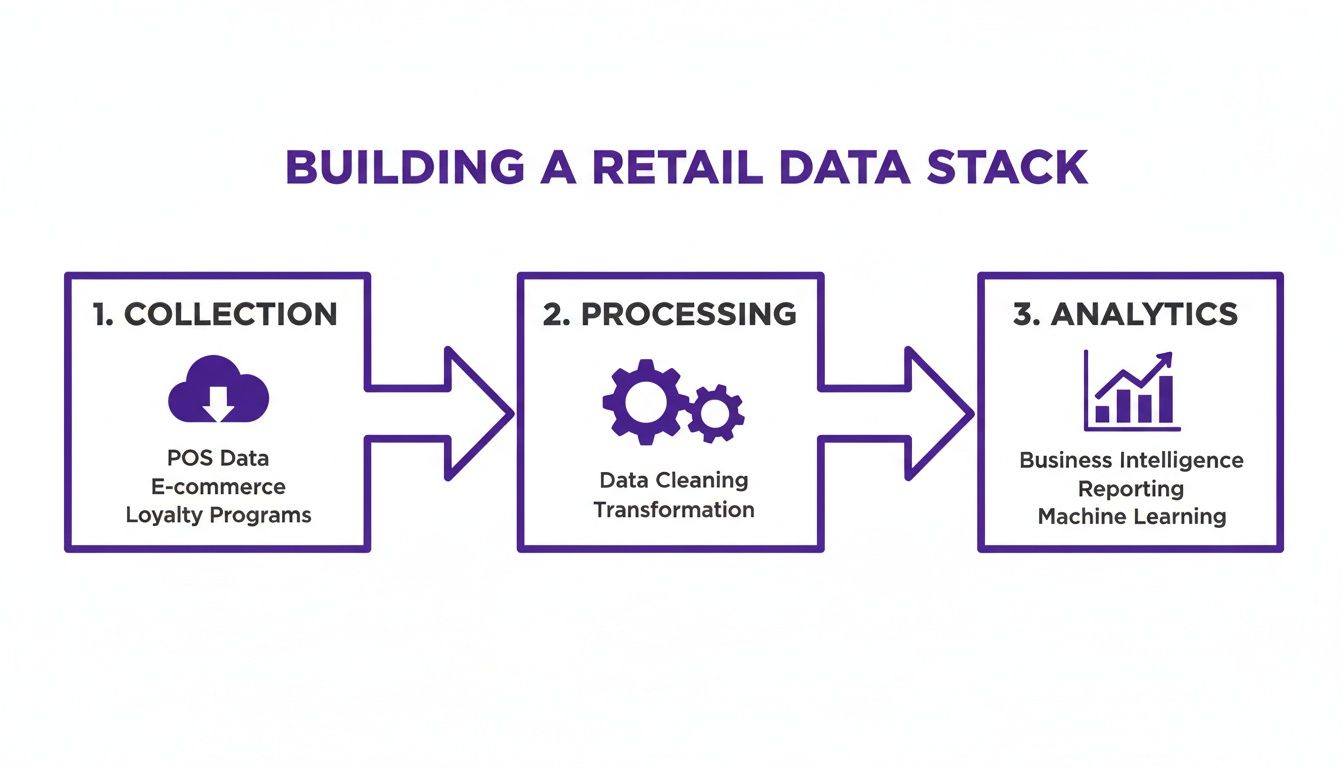
This model simplifies the process into three fundamental steps: collecting raw market intelligence, cleaning it up for accuracy, and finally, turning that structured data into insights you can act on.
Phase 1: Define a Singular Business Goal
First, resist the urge to boil the ocean. A vague goal like "improve our pricing" is a recipe for failure. Define a specific, measurable objective that solves a genuine pain point. A sharp initial goal gives your team focus and makes it simple to measure success.
Good starting points are laser-focused:
- Protect Brand Value: "Enforce MAP compliance across our top 20 SKUs on Amazon and our two most important retail partner websites."
- Gain a Competitive Edge: "Monitor the pricing and stock levels of our top competitor’s five best-selling products."
- Optimize Margins: "Identify unauthorized sellers undercutting our prices on our flagship product line."
This specificity transforms an abstract data project into a concrete commercial initiative with a clear finish line.
Phase 2: Identify Key Data Sources
With a clear goal, you now know exactly what data you need. You don't have to track every competitor on every channel. Start with the sources that matter most and directly feed into the goal you set in Phase 1.
For the MAP enforcement example, your data sources might be as simple as:
- The Amazon product pages for those 20 specific items.
- The product pages on the two specified retail partner sites.
That’s it. By narrowing your view to a handful of critical URLs, you make data collection manageable and cost-effective. You can always expand the scope later.
Phase 3: Launch a Focused Pilot Project
Now it's time to put your plan into action. A pilot project is a small-scale test designed to prove the concept and show value quickly. For our MAP enforcement scenario, a pilot means setting up a system to automatically track the prices of your 20 SKUs on those few designated websites.
The objective of a pilot isn’t perfection; it’s validation. The goal is to confirm you can collect the right data, generate insights (like MAP violation alerts), and use that information to take a specific business action, such as contacting a non-compliant seller.
This is where specialized tools are a game-changer. Instead of building a data collection engine from scratch, a platform like Market Edge can be configured to monitor the specific URLs you identified. This lets you launch your pilot in days, not months. If you're exploring options, our guide to the best price monitoring software is a great place to start.
Phase 4: Analyze, Act, and Scale
Once your pilot is running, close the loop. Analyze the data, take the planned action, and measure what happens. Did contacting a non-compliant seller lead to a price correction? Did you spot an opportunity to adjust your price when a competitor went out of stock?
By documenting these small wins, you build a powerful business case for expansion. You can show stakeholders a direct line between the data initiative and a positive commercial result. With that proof, scaling becomes a logical next step—monitoring more products, tracking more competitors, or tackling the next business goal.
This phased approach provides a clear, manageable path.
Big Data Implementation Roadmap
| Phase | Key Actions | Primary Goal |
|---|---|---|
| 1: Define Goal | Isolate one specific, high-impact business problem (e.g., MAP enforcement on key products). | Create a measurable objective with a clear finish line to ensure focus and prove value. |
| 2: Identify Sources | Pinpoint the exact, minimal data sources needed to address the goal (e.g., specific competitor URLs). | Keep the initial data collection scope small, manageable, and cost-effective. |
| 3: Launch Pilot | Use specialized tools to quickly set up a small-scale data collection and analysis project. | Validate the technical process and demonstrate the ability to generate actionable insights quickly. |
| 4: Analyze & Scale | Review pilot results, take action based on the data, and document the business impact (the "win"). | Build a strong, evidence-based case to secure buy-in for expanding the project's scope. |
Following these steps turns a potentially massive undertaking into a series of achievable wins.
Navigating Common Pitfalls on Your Data Journey
Many big data projects in retail go off the rails. It’s rarely the technology that fails. More often, it's a handful of strategic missteps that are surprisingly common—and completely avoidable.
Knowing these traps ahead of time is half the battle. If you can spot them, you can steer your project toward measurable results instead of getting lost in complexity. Success isn't about finding the perfect algorithm; it's about keeping a relentless focus on the business outcome.
Pitfall 1: Starting Too Big
This is the classic mistake. A leader decides to "overhaul our entire supply chain with data," and the project is doomed before it begins. The goal is massive, vague, and impossible to measure. This leads to scope creep and blown budgets.
The fix is to think small. Start with a single, highly specific goal you can achieve. Instead of a massive overhaul, a manufacturer could aim to "reduce unauthorized discounting by 15% on our top five SKUs within 90 days." That is a target you can hit, measure, and build upon.
Pitfall 2: Focusing on Tools Over Problems
It’s easy to get distracted by shiny new technology. We see it all the time: a company invests in a powerful analytics platform without first identifying the business question it needs to answer. This "tool-first" mindset leads to sophisticated software that gathers digital dust.
The solution? Always lead with the business problem. Before looking at a demo, you must be able to clearly state the challenge. Are you losing sales because your prices are out of sync? Is your brand diluted by sellers ignoring your MAP policy? Once you have the problem nailed down, then you look for a tool that solves it. This is why platforms like Market Edge exist—they’re designed to solve specific problems like price monitoring and MAP enforcement.
A data project should never be about the data itself. It must be about answering a critical business question that leads to a profitable action. If you can't state the question in one sentence, you're not ready to look for a tool.
Pitfall 3: Ignoring Data Quality
This is the deadliest mistake. Making high-stakes decisions on pricing or inventory using bad data is often worse than just using intuition.
If your system can't correctly match your product to a competitor's listing, any "data-driven" price change is just a shot in the dark. You could be giving away margin or pricing yourself out of the market entirely. You cannot compromise on data quality.
- Accurate Product Matching: The system must know your product is the same as one on a different retailer's site, even if names or descriptions differ.
- Data Cleaning: Your process must automatically filter out errors, duplicates, and inconsistencies.
- Timeliness: The data must be fresh. A price from last week is ancient history in ecommerce.
By dodging these three pitfalls, you shift the odds in your favor. When you start small, focus on solving real problems, and insist on clean data, you're not just launching a project—you're building a foundation for long-term success.
Your Actionable Big Data Checklist
Theory is great, but results are what matter. Let's distill everything into a practical checklist to get a data-driven retail initiative off the ground and prove its value fast.
Phase 1: The Strategic Blueprint
Before you collect a single byte of data, you need to know why. A rock-solid commercial objective is the difference between a successful project and a costly experiment.
-
Nail Down Your Core Business Problem: Start with one high-impact question. Are you trying to stamp out MAP violations? Do you need to fine-tune your pricing against a specific competitor? Get it down to a single, clear sentence.
-
Pinpoint Your Key Competitors: Don't try to boil the ocean. Who are the 3-5 players whose pricing and inventory moves actually impact your bottom line? List them out.
-
Find Your Data Blind Spots: What crucial information are you missing? Be specific. For example: "We have no real-time visibility into Competitor X's stock levels for our top 10 SKUs."
Phase 2: Execution
With a clear plan, it's time to execute. This phase is about putting the right tools and processes in place to get the data you need and put it to work.
-
Launch a Focused Pilot Project: Based on your core problem, pick a small-scale, low-risk test. A perfect example is monitoring MAP compliance for one product line on a single major marketplace like Amazon.
-
Define Success Metrics: How will you prove this pilot was worth it? Your metrics must be tied to business outcomes. Think in terms of the number of MAP violations fixed, the margin points gained from a pricing tweak, or the market share captured when a competitor went out of stock.
Remember, the point of a data initiative isn’t just to hoard information. It’s to drive a real commercial outcome. A pilot with clear, hard metrics delivers undeniable proof of value.
- Engage a Specialized Data Provider: Your team shouldn't be bogged down with data collection. Find a partner who can deliver the clean, structured data you need for your pilot. This is where automated tools like Market Edge become useful—they handle the heavy lifting of data gathering and product matching, freeing you up to make strategic decisions.
Frequently Asked Questions About Big Data in Retail
B2B decision-makers always have practical questions about putting big data to work. Let's tackle some of the most common concerns about cost, complexity, and seeing a return on the effort.
How Much Does It Cost to Implement a Big Data Strategy?
The answer depends on how you start. A custom-built, in-house system with a full data team is a massive investment and not the right first step for most businesses.
A much smarter, more budget-friendly approach is to start small. Pick a single, high-impact problem and solve it with a specialized tool. For example, using a price monitoring platform to track key competitors is affordable and often pays for itself within weeks. The key is to solve a real business problem first, prove the value, and then build from there.
Do I Need to Hire Data Scientists to Get Started?
Not right away. While data scientists are crucial for building complex predictive models later on, you can achieve significant commercial wins without one on day one.
Modern analytics platforms are built for business users. Tools like Market Edge handle the heavy lifting—data scraping, cleaning, and product matching—in the background. They serve up clear, actionable insights in a dashboard that your pricing analysts or category managers can use immediately. You can bring in data science expertise later as your strategy becomes more sophisticated.
What Is the Fastest Way to See a Return on Investment?
You'll see the quickest ROI by focusing on activities that directly impact revenue and profit. In our experience, three areas consistently deliver fast, measurable financial results:
-
Dynamic Pricing: The ability to adjust prices in near real-time based on competitor actions or market demand can boost sales and protect margins immediately.
-
MAP/RRP Enforcement: For brands, catching and resolving MAP violations quickly stops price erosion, protects brand value, and keeps authorized retail partners satisfied.
-
Competitor Stock Monitoring: Seeing that a top competitor is out of stock on a bestseller is a golden opportunity. It’s a clear signal to increase your marketing and capture that demand before they can restock.
Nailing these use cases provides a tangible financial win that builds momentum and makes it easier to get buy-in for expanding your use of data-driven strategies into other areas. This is where automated price monitoring tools like Market Edge become useful.