When we talk about big data in the retail industry, we're referring to the practice of gathering, processing, and analyzing large, complex datasets to uncover patterns that drive smarter commercial decisions. This goes beyond traditional sales reports. It’s about blending diverse information—like customer behavior, competitor pricing, and supply chain movements—to build a forward-looking, profitable strategy.
What Big Data in Retail Actually Means for Decision-Makers
For a retail leader, "big data" is not just a technical buzzword. It’s the engine that fuels survival and growth in a fiercely competitive market.
Think of it this way: traditional reporting is like looking at a single photograph of your sales from last month. It tells you what happened, but offers little context. In contrast, big data in the retail industry is like watching a full-motion video of your entire market. It shows you what happened, why it happened, and provides a clear view of what is likely to happen next.
This deeper level of insight comes from combining different types of data. Your internal information, like point-of-sale transactions and inventory levels, is just one piece of the puzzle. The real commercial advantage comes from enriching that internal data with external streams.

From Reactive Fixes to Proactive Strategy
Without a complete market view, retailers often get stuck in a reactive loop—slashing prices after a competitor does, or dealing with stockouts only after customers start complaining. Big data flips that script. It enables you to build proactive strategies that protect margins and capture market share.
It achieves this by answering critical commercial questions:
- Why did sales for a top product suddenly drop? Big data can connect that sales dip to a competitor who just launched an aggressive promotion across three major online marketplaces.
- Which new products should we stock? By analyzing social media trends and competitor stock data, you can spot rising demand long before it peaks.
- Is anyone violating our MAP policy? Automated monitoring provides real-time alerts on pricing violations, letting you enforce your MAP/RRP rules immediately to protect brand value.
This shift from guesswork to data-driven strategy is a significant commercial advantage, backed by serious investment. The global market for big data analytics in retail is expected to grow from USD 6.38 billion to USD 35.98 billion by 2033. Ecommerce businesses are at the forefront of this trend, proving how essential web analytics are for growth. For a deeper dive, you can explore more retail data trends on SkyQuestt.com.
The table below breaks down this fundamental shift.
Traditional Reporting vs. Big Data Insights
| Attribute | Traditional Reporting | Big Data Analytics |
|---|---|---|
| Focus | "What happened?" (Past) | "Why did it happen & what will happen next?" (Future) |
| Data Sources | Mostly internal (e.g., sales, inventory) | Internal + External (e.g., market trends, competitor prices) |
| Timing | Historical (weekly, monthly) | Real-time and predictive |
| Outcome | Reactive adjustments | Proactive, strategic planning |
Ultimately, the goal is to stop reacting to the market and start shaping your own outcomes.
By blending external market intelligence with your internal sales figures, you get a 360-degree view. You are no longer just looking at your performance in a vacuum; you are seeing the entire competitive landscape. This turns your data from a simple record of the past into a powerful asset for future growth.
Putting Big Data to Work in Your Retail Business
Understanding what big data is gets you to the starting line. The race is won by applying it to solve everyday commercial problems. For retail decision-makers, this is where theory is left behind and we focus on practical applications that directly boost revenue, protect margins, and streamline operations.
This is the point where big data in the retail industry stops being a buzzword and becomes your most valuable strategic tool. Instead of relying on last quarter's reports or gut feelings, you can use a live stream of market information to pivot with market shifts, get ahead of customer needs, and fine-tune everything from pricing to stock levels.

Let's dive into the three main areas where data is making the biggest commercial impact right now.
Dynamic Pricing and Competitor Monitoring
In retail, and especially ecommerce, pricing is a moving target. A price that was profitable yesterday could be sending customers to your competitors today. This is the exact problem that dynamic pricing—a strategy where prices adjust in near real-time based on market signals—is built to solve.
The core business problem is simple: how do you set prices to maximize profit without losing sales? Manually tracking every competitor’s price for thousands of SKUs across Amazon, Google Shopping, and their websites is impossible.
This is where a data-driven solution comes in. It works by constantly pulling in and analyzing key external data points:
- Competitor Prices: You need to know the exact price of identical or similar items across every relevant channel.
- Stock Availability: Knowing when a key competitor goes out of stock is a prime opportunity to capture their would-be customers, often at a better margin.
- Promotional Activity: When a rival launches a sale, you need to know immediately so you can decide how—or if—to respond.
- MAP/RRP Violations: For brands, automated monitoring is the only scalable way to catch unauthorized sellers undercutting your pricing policies and damaging your brand's value.
By feeding this live market intelligence into a pricing engine, you can automate your responses. For instance, if your main rival on a bestseller runs out of stock, your system can automatically nudge your price up to improve margin while capturing the new demand. This is precisely what automated tools are designed for—delivering the clean, structured data you need to power these smart pricing decisions. You can learn more in our deep-dive on dynamic pricing in retail.
Demand Forecasting and Inventory Management
Few things are more costly in retail than the gap between what you have and what customers want. Overstocking ties up cash and warehouse space, while understocking means lost sales and unhappy shoppers who may not return. Big data addresses this with far more accurate demand forecasting.
Traditional forecasting typically relies only on historical sales data, which can be misleading. A sales spike for a product last June might have been caused by a one-off viral social media post, not a reliable seasonal trend.
Big data forecasting builds a much richer, more reliable picture by blending your internal sales history with external signals. It doesn’t just see what happened; it helps you understand why.
This modern approach to forecasting incorporates factors like:
- Market Trends: Analyzing search volumes and social media chatter to see which products are gaining traction before demand peaks.
- Seasonality and Events: Looking beyond major holidays to factor in regional events, school schedules, and even weather patterns that influence buying behavior.
- Economic Indicators: Monitoring broader economic data that might signal changes in consumer spending habits.
- Competitor Assortment: Tracking when competitors launch a new product or discontinue an old one, as this can directly shift demand to your store.
With this level of insight, inventory management becomes a strategic advantage. You can confidently increase orders for items projected to trend upward and pull back on those showing signs of decline, freeing up cash flow and ensuring you have the right product on the shelf at the right time.
Hyper-Personalization and Customer Experience
Today’s shoppers expect personalization. The old approach of sending the same marketing email to everyone is ineffective. Big data makes hyper-personalization possible, allowing you to tailor the shopping experience to each individual.
The challenge is moving beyond broad segments like "millennial shoppers" and treating each customer as a "segment of one." To do that, you must understand their specific tastes, browsing habits, and purchase patterns.
By gathering and analyzing data from every customer interaction, you can craft personal experiences that drive sales:
- Product Recommendations: Go beyond generic suggestions. Use a customer's full browsing and purchase history to recommend products they are genuinely likely to buy.
- Targeted Promotions: Instead of a generic 10% off coupon, send an offer for a specific brand of dog food to a customer who buys it monthly.
- Customized Content: Show a user who has been browsing hiking gear your latest outdoor collection the moment they land on your site.
This isn’t just about boosting short-term conversion rates. It’s about building loyalty. When customers feel a retailer understands them, they are more likely to become repeat buyers.
Building Your Retail Data Foundation
To derive real value from big data, you need a solid foundation—a single source of truth where all information from your business and the broader market comes together. This is not just a technical project; it's a strategic imperative that aligns marketing, sales, and operations.
Think of it like building a house. You wouldn't put up walls without first pouring a strong, level concrete slab. In retail, that slab is your data platform. It's where all your information is collected, cleaned, and prepared for analysis. Without it, you get data silos, with different teams looking at different numbers, leading to disjointed strategies and missed opportunities.
Identifying Your Essential Data Streams
A powerful data foundation pulls from two equally important sources: internal and external data. Relying on just one gives you an incomplete picture of what’s actually happening.
Internal Data Sources are the information your business generates daily. This is the bedrock of understanding your own performance.
- Point-of-Sale (POS) and Transaction Data: What are people buying, where, and when?
- Web and App Analytics: How do shoppers navigate your site? Where do they drop off?
- Customer Relationship Management (CRM) Data: Purchase history, loyalty status, and support interactions.
- Inventory and Supply Chain Data: What you have, where it is, and supplier lead times.
This internal data tells you what's happening inside your business. The problem is, it can't tell you why it's happening in the context of the wider market.
Why Internal Data Alone Is Not Enough
Imagine trying to drive on a busy highway by only looking at your speedometer. You know your own speed, but you have no idea about other cars, traffic jams, or detours. Running a retail business on internal data alone is just as risky.
To make smart, strategic decisions—especially on pricing or assortment—you must blend your internal data with what's happening outside.
Your internal data shows sales for a specific product dropped by 15%. External data reveals it's because three of your biggest competitors just launched an aggressive sale and a new, cheaper alternative hit the market. One is a report; the other is an actionable insight.
This is why retailers are investing heavily in technologies that can make sense of these combined datasets. In fact, 87% of retailers in the US and Europe are already using AI, and 60% plan to increase their spend. These investments are all about getting a handle on complex internal and external information. You can dig deeper into this trend by checking out detailed market reports on Mordor Intelligence.
The Role of External Market Intelligence
External data provides the market context your internal reports are missing. It’s the key to shifting from reacting to problems to proactively making moves that protect your margins.
Here are the external streams that matter most for commercial teams:
- Competitor Pricing and Stock Data: Real-time information on what rivals are charging and whether key products are in stock.
- Marketplace Data (Amazon, Google Shopping): Visibility into pricing, promotions, and seller activity on major platforms.
- MAP/RRP Monitoring Data: Essential for brands to spot unauthorized sellers and pricing violations that devalue your products.
- Social Sentiment and Trend Data: What consumers are saying online about your brand, competitors, and emerging product categories.
Gathering, cleaning, and structuring external data is a massive challenge if done manually. This is where specialized platforms become essential. An automated solution that provides a steady stream of clean market intelligence, such as the data from Market Edge, eliminates the manual work. It delivers the reliable competitor insights you need to make sharp, confident decisions. Our guide on selecting the best ecommerce price monitoring tools is a great place to start.
Your Step-By-Step Big Data Implementation Roadmap
Implementing a big data strategy can feel like a massive undertaking. However, the smart way to leverage big data in the retail industry is to follow a practical, step-by-step roadmap that delivers value at every stage.
This approach helps you avoid common pitfalls, like expensive projects with unclear goals. Instead, you focus on solving one business problem at a time, showing a tangible return on investment quickly and building momentum.
Step 1: Pinpoint Your Business Objective
The best data strategies start with a business problem, not technology. Before considering platforms or tools, ask: "What is the most urgent commercial problem we need to fix?"
Starting with a laser-focused goal ensures your initial efforts make the biggest impact. It cuts through "analysis paralysis" and provides a clear finish line.
Examples of strong, focused objectives:
- MAP Policy Enforcement: The goal is to automatically detect and document pricing violations on key online marketplaces to stop brand erosion.
- Competitor Price Optimization: The objective is to lift gross margin by 5% on your top 50 SKUs by reacting faster to competitor pricing and stock levels.
- Stockout Reduction: The aim is to cut lost sales from out-of-stocks by 10% by improving demand forecasting for your best-selling product line.
Step 2: Audit Your Existing Data
Once your goal is clear, identify what data you have and what you're missing. Most retailers possess a wealth of internal data from POS systems, web analytics, and CRMs. This is excellent for understanding your own operations.
But to solve problems like MAP enforcement or competitive pricing, you need a constant stream of external market intelligence. Your audit should highlight these gaps.
This flowchart illustrates how internal operational data and external market intelligence merge to create a single, powerful view.
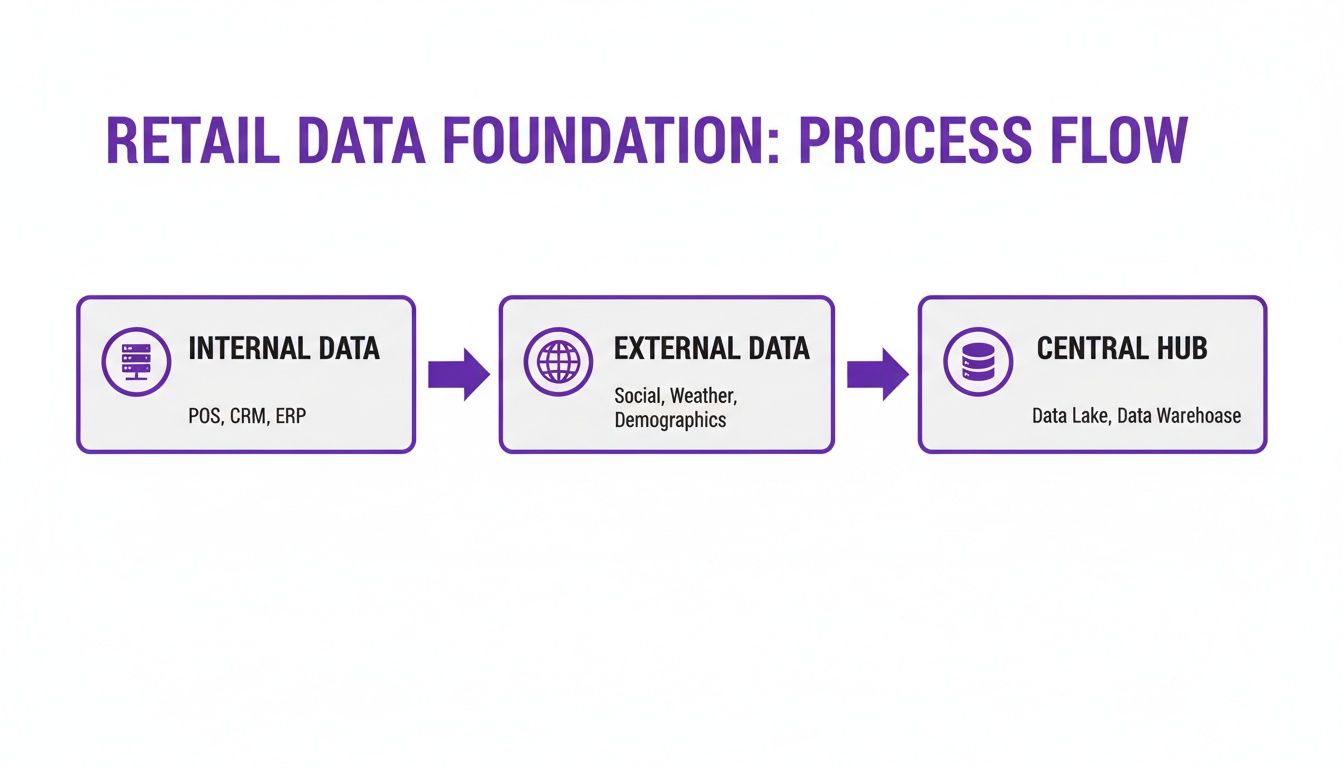
A solid data foundation isn't just about what you know about your business. It's about combining that with what's happening in the market to make truly strategic moves.
Step 3: Choose the Right Tools
With a clear objective and a map of your data gaps, you can select the right technology. The key is to pick tools that solve your specific problem, not the most complex platform available.
If your primary goal is competitor monitoring, you don't need a massive, all-in-one business intelligence suite. You need a specialized tool that excels at scraping clean, accurate, and timely pricing and stock data from the websites and marketplaces that matter to you.
This is where a vendor-neutral solution like Market Edge becomes essential. It plugs into your existing systems, delivering the external data you need without requiring your team to build and maintain a complex web-scraping operation.
Step 4: Assemble Your Data Team
You don't need to hire an army of data scientists. For a pilot project, a small, agile team is more effective. Your starting lineup should include people who can bridge the gap between data and business strategy.
Key roles include:
- Business Analyst: Someone who understands the commercial goals and can translate them into data requirements.
- Data Analyst or BI Manager: The hands-on person who will work with the data, build dashboards, and extract actionable insights.
- Project Sponsor: A senior leader (e.g., ecommerce or sales manager) who champions the project and ensures it stays aligned with business goals.
Step 5: Launch a Focused Pilot Project
Start small with a focused pilot project. A pilot is a controlled experiment designed to prove your data strategy works on a manageable scale. It minimizes risk, contains costs, and provides a success story to share across the company.
Your pilot project is your proof of concept. It should be designed to deliver a clear, measurable win in 90 days or less. Success here builds the confidence and internal buy-in needed to scale your efforts.
The demand for these capabilities is growing. The big data analytics market in retail is projected to hit USD 14.1 billion by 2026. While customer analytics has been a major focus, the fastest-growing area is now fraud detection—showing that retailers are zeroing in on protecting the bottom line. You can read the full research on retail data priorities. This all points to the same conclusion: starting with a clear, high-value problem is the way to win.
Measuring the True ROI of Your Retail Data
A data strategy is only as good as the results it delivers to the bottom line. Investing in big data for retail is not about collecting information for its own sake; it's about turning that data into measurable financial wins. To secure budgets and prove your efforts are paying off, you must connect your data initiatives directly to profit and loss.
This means moving beyond vague metrics and focusing on the Key Performance Indicators (KPIs) that matter to different teams. When you can show a pricing manager exactly how a data project is boosting margins, you get their full support. When the head of operations sees a direct link between your data and fewer stockouts, the project sells itself.
Key Metrics for Pricing and Ecommerce Teams
For those focused on pricing, promotions, and online sales, the ROI from big data is measured in profitability and market share. The goal is to use better intelligence to make smarter, faster decisions that protect and grow revenue.
Here are the KPIs that count:
- Gross Margin Return on Investment (GMROI): This metric tells you how much gross profit you generate for every dollar invested in inventory. Using data to optimize pricing and clear slow-moving products directly improves GMROI.
- Price Index vs. Competitors: This index shows your pricing position relative to the competition. A constant feed of competitor data lets you manage this index with precision, deciding when to undercut, match, or charge a premium.
- Customer Lifetime Value (CLV): For ecommerce leaders, big data enables personalization that turns one-time shoppers into repeat customers. Tracking the average CLV of customers acquired through personalized campaigns measures the long-term profit impact of your data.
- Conversion Rate Improvement: Analyzing web traffic and user behavior helps you identify and fix friction points in the customer journey. A steady lift in your conversion rate is a clear, quantifiable return on your analytics work.
Key Metrics for Operations and Supply Chain Managers
For those managing the flow of products, the value of big data is about efficiency and cost reduction. The right data removes guesswork from inventory management, preventing costly mistakes like overstocking or running out of stock.
These are the operational KPIs to monitor:
- Inventory Turnover: This classic supply chain metric shows how quickly you sell through your entire stock. Accurate demand forecasting, fueled by big data, leads to a higher turnover rate, freeing up cash for growth. For more details, see our guide on the inventory turnover ratio explained.
- Stockout Rate Reduction: Lost sales from stockouts are pure poison for your bottom line. Tracking the reduction in out-of-stock incidents for key products allows you to calculate the exact revenue saved and customer goodwill preserved.
A common mistake is treating a data project as a cost center. From day one, tie every project to a core business KPI. This reframes the work as a profit center. The goal isn't just to analyze data; it's to use that analysis to drive up GMROI or slash stockouts.
Building a Compelling Business Case
To get stakeholder buy-in, you must translate these KPIs into a simple financial story. Present a business plan powered by data, not a complex technical roadmap.
ROI Business Case Checklist:
- Identify the Pain Point: Start with a specific business problem. Example: "We are losing 5% margin on our top 100 products because our pricing is too slow to react."
- Define the Data-Driven Solution: Explain the fix in business terms. "We will implement automated price monitoring to adjust our prices based on real-time competitor stock and pricing."
- Project the Financial Impact: Quantify the expected result. "This will help us recapture a 2% margin improvement, adding an estimated $250,000 to our gross profit this year."
- Outline the Investment: Be transparent about the cost of tools and resources.
- Calculate the ROI: Show the simple math: (Projected Gain - Investment Cost) / Investment Cost.
This is where automated tools like Market Edge come into play, providing the critical external data needed to build these ROI calculations and execute profitable strategies.
Common Questions About Big Data in Retail
Even with a clear roadmap, questions will arise as you develop your data strategy. Here are straightforward answers to some of the most common queries from retail leaders.
How Can Small Retailers Use Big Data on a Budget?
For smaller retailers, "big data" can sound prohibitively expensive. However, you don't need a massive infrastructure or a team of data scientists to get started.
The key is to think small and targeted. Pick one specific, painful problem and find a tool that solves it.
A perfect example is competitive pricing. Manually checking competitor websites daily is time-consuming, error-prone, and doesn't scale. Building a custom solution is often not feasible.
Instead of hiring a developer to build a web scraper—a complex project requiring constant maintenance—a small retailer can subscribe to a ready-made platform. This provides the necessary data immediately, without the high upfront cost and technical overhead.
This approach offers several advantages for budget-conscious businesses:
- Low Upfront Cost: A predictable subscription fee instead of a large capital investment.
- Immediate Value: The tool is already built to solve your problem, providing actionable data from day one for tasks like price monitoring or MAP enforcement.
- Zero Technical Overhead: The provider handles the complexities of data collection and maintenance behind the scenes.
This is exactly where a tool like Market Edge fits in. It delivers the competitor pricing and stock data needed to make smart decisions, allowing a small team to compete effectively without breaking the bank.
What Are the Biggest Implementation Challenges?
While the payoff of using big data in the retail industry is significant, the path to implementation has challenges. The biggest roadblocks are rarely technological; they are related to data, people, and process.
The number one obstacle is often poor data quality. If your source data is inaccurate, incomplete, or inconsistent, any analysis will be worthless. This "garbage in, garbage out" problem can derail a project before it starts.
Another hurdle is a shortage of the right skills. Finding people who understand both the business context and the data is difficult. Without this bridge, it’s easy to drown in information without finding actionable insights.
Finally, never underestimate internal resistance to change. Shifting from a culture of "gut-feel" decisions to one driven by data is a major leap. Team members may be skeptical or feel that new tools threaten their established workflows.
Here are a few ways to get ahead of these challenges:
- Start with a Pilot Project: Don't try to change everything at once. Pick a small, focused project with a clear goal. Proving value on a small scale is the best way to build momentum and get buy-in.
- Partner for Data Integrity: Instead of trying to clean messy external market data yourself, work with providers who specialize in delivering clean, structured information.
- Focus on Business Outcomes: Frame your project around solving a real commercial problem, not just implementing new technology. When everyone understands the "why" and sees the benefit, they are more likely to get on board.
How Does Big Data Help Brands with MAP Enforcement?
For any brand, protecting your price is about protecting your value. A Minimum Advertised Price (MAP) or Recommended Retail Price (RRP) policy is your best defense, but enforcing it across the internet is a monumental task.
This is a problem perfectly suited for a big data approach.
It all comes down to continuous, automated monitoring. You cannot manually check thousands of product listings across countless websites and marketplaces. A data platform can.
Here’s how it works in practice:
- Systematic Web Scanning: Automated crawlers constantly scan key marketplaces like Amazon and the websites of all your authorized dealers.
- Accurate Product Matching: AI-powered algorithms identify your products with precision, even when sellers use slightly different names or images.
- Price and Seller Data Capture: The system records the advertised price for every listing, captures the seller's details, and takes a time-stamped screenshot for proof.
- Instant Violation Flagging: This data is automatically compared against your official MAP policy. The moment a listing drops below the minimum price, you receive an alert.
This process transforms MAP enforcement from a reactive, manual chore into a proactive, scalable system. You get the indisputable proof needed to take swift action, protecting your channel partners and the perceived value of your products.
This is where automated price monitoring tools like Market Edge become useful. You can learn more by visiting https://marketedgemonitoring.com.