Understanding your profit margin is fundamental to strategic business management. The calculation itself is straightforward: divide your net income by your total revenue, then multiply by 100 to express it as a percentage.
The formula is: (Net Income / Revenue) x 100 = Net Profit Margin %.
This calculation reveals how much profit your business generates for every dollar of revenue. For B2B decision-makers, mastering this metric is non-negotiable for informed pricing, inventory, and operational planning.
Why Profit Margin Is a Critical Business Health Metric
Profit margin is more than an accounting figure; it is a direct measure of your company's financial health and operational efficiency. High revenue figures are misleading if margins are thin, as you could be losing money on each transaction—a common trap in competitive markets.
For leaders in ecommerce and distribution, this metric is the foundation for strategic decisions. It dictates pricing strategies, guides inventory investment, and informs marketing budget allocation.
Consider the macro view: the world's 1,600 largest public companies generated $4.85 trillion in profits in a single year, a 12.2% increase, according to an article on Trustnet.com. This growth underscores a key business principle: sustainable success is built on optimizing profitability, not just chasing revenue. For distributors and online retailers, the clear takeaway is the necessity of vigilant competitor price monitoring to protect and grow margins.
Understanding the Different Types of Profit Margin
A comprehensive financial analysis requires examining three distinct types of profit margin. Each provides a different perspective on your company's performance.
-
Gross Profit Margin: This measures profitability after subtracting the direct costs associated with producing or acquiring your goods, known as the Cost of Goods Sold (COGS). It reflects the core efficiency of your production and pricing.
-
Operating Profit Margin: This calculation expands on gross margin by also subtracting operating expenses (OpEx), such as marketing, rent, and administrative salaries. It reveals the profitability of your core day-to-day business operations.
-
Net Profit Margin: This is the ultimate "bottom line," accounting for all expenses, including interest and taxes. It shows the final percentage of revenue that is converted into profit.
Differentiating between these three margins is the first step toward diagnosing your company's financial strengths and weaknesses. For instance, a strong gross margin paired with a weak net margin is a clear indicator that high operating expenses are eroding your profitability.
With a firm grasp of these calculations, you can shift from reactive problem-solving to proactive strategy, ensuring every business function contributes to a healthy bottom line. This is where automated price monitoring tools like Market Edge can provide a significant strategic advantage.
The Three Core Profit Margin Formulas
To gain a precise understanding of your business's financial health, it is essential to analyze profitability at three distinct levels. By calculating your Gross, Operating, and Net Profit Margins, you can accurately diagnose where your business is performing efficiently and where it is leaking capital.
Each formula serves as a specific diagnostic tool. A healthy Gross Profit Margin indicates that your pricing and product sourcing are well-aligned. A strong Operating Profit Margin signifies that your daily operations are lean and effective. Finally, a robust Net Profit Margin confirms the viability of your entire business model after all expenses are accounted for.
These metrics are directly influenced by key operational levers: your pricing strategy, inventory management, and marketing spend.
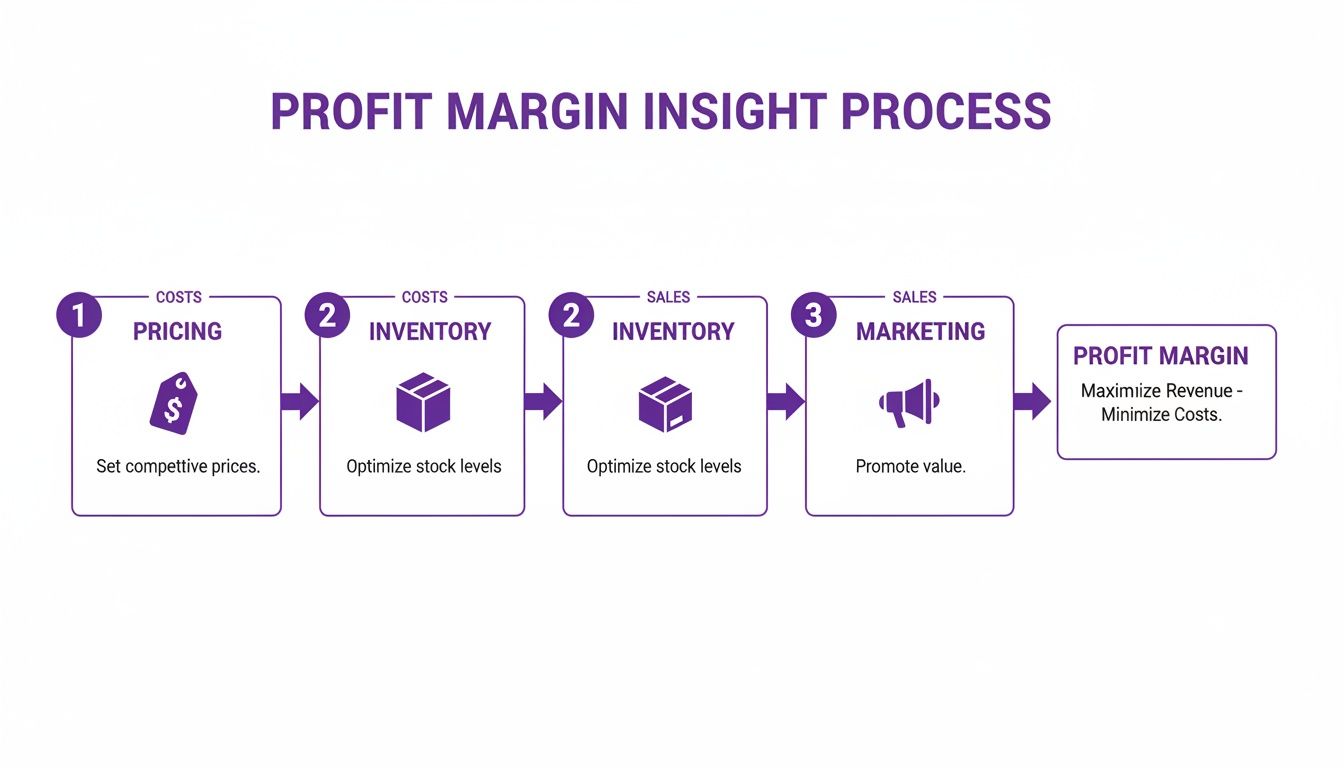
As the diagram illustrates, a minor adjustment to your pricing directly impacts your product margins. This, in turn, influences your available marketing budget and the return on investment you can realistically target. The elements are interconnected.
For quick reference, here are the three core formulas.
Profit Margin Formulas at a Glance
| Margin Type | Formula | What It Measures |
|---|---|---|
| Gross Profit Margin | [(Revenue - COGS) / Revenue] x 100 | Profitability of core products, minus direct production or acquisition costs. |
| Operating Profit Margin | [Operating Income / Revenue] x 100 | Efficiency of core business operations before interest and taxes. |
| Net Profit Margin | [Net Income / Revenue] x 100 | Overall profitability after all expenses, including interest and taxes. |
These formulas provide the framework for analyzing your financial performance. Let's examine each one in detail.
How to Calculate Gross Profit Margin
Gross Profit Margin is the most fundamental profitability metric. It quantifies the profit generated from sales after subtracting only the direct costs associated with those goods, known as the Cost of Goods Sold (COGS).
The formula is:
Gross Profit Margin = [(Revenue - COGS) / Revenue] x 100
This metric reveals how effectively your business converts inventory into profit. For an ecommerce store or distribution business, it directly reflects your pricing power and supplier costs. A low gross margin is a red flag, indicating that prices may be too low or procurement costs are too high.
Real-World Example: B2B Distributor Gross Margin
A B2B electronics distributor sells a server for $2,500. The landed cost for the server—including the manufacturer's price, shipping, and import duties—is $1,750.
- Revenue: $2,500
- COGS: $1,750
- Calculation: [($2,500 - $1,750) / $2,500] x 100 = 30%
This 30% gross margin means that for every dollar of revenue from this sale, the distributor retains 30 cents to cover all other operating expenses and generate net profit.
How to Calculate Operating Profit Margin
While crucial, gross margin overlooks the operational costs of running a business. Operating Profit Margin provides a deeper layer of insight by factoring in all operating expenses (OpEx).
OpEx includes costs not directly tied to product production, such as marketing, sales commissions, warehouse rent, and administrative salaries.
The formula is:
Operating Profit Margin = [Operating Income / Revenue] x 100
Note that Operating Income = Revenue - COGS - Operating Expenses.
This metric is a strong indicator of core operational efficiency. A high operating margin suggests a well-run business model before accounting for financing and tax obligations. If your gross margin is strong but your operating margin is weak, it is a clear sign that overhead is excessive. This often requires a review of spending and pricing models. For a closer look at pricing structures, explore these cost-plus pricing examples.
How to Calculate Net Profit Margin
Net Profit Margin is the ultimate measure of profitability—the "bottom line." It represents the percentage of revenue remaining after all expenses have been deducted: COGS, operating expenses, interest, and taxes.
The formula is the most comprehensive of the three:
Net Profit Margin = [Net Income / Revenue] x 100
Here, Net Income = Revenue - All Expenses (COGS, OpEx, Interest, Taxes).
For a founder, ecommerce manager, or sales leader, this is the definitive metric. It answers the critical question: "After all costs are paid, how much profit did the business generate?" A healthy net profit margin indicates that the business is not only operationally efficient but also managing its debt and tax obligations effectively. This is the capital available for reinvestment, owner distributions, or building cash reserves.
Putting It All Together: A Comprehensive Example
Using our B2B electronics distributor, let's analyze one month of financial data.
- Total Revenue: $1,000,000
- Total COGS: $700,000 (maintaining their 30% gross margin)
- Operating Expenses: $150,000 (salaries, marketing, rent)
- Interest & Taxes: $50,000
First, we calculate the profit at each stage:
1. Gross Profit: $1,000,000 - $700,000 = $300,000 2. Operating Income: $300,000 - $150,000 = $150,000 3. Net Income: $150,000 - $50,000 = $100,000
Now, we calculate the margins as percentages of revenue:
- Gross Profit Margin: ($300,000 / $1,000,000) x 100 = 30%
- Operating Profit Margin: ($150,000 / $1,000,000) x 100 = 15%
- Net Profit Margin: ($100,000 / $1,000,000) x 100 = 10%
This analysis shows that while the distributor has a solid 30% margin on its products, operating costs and financial obligations reduce the final take-home profit to 10%. This illustrates why protecting the initial gross margin from competitive price pressure is so critical—and where automated price monitoring tools provide a clear advantage.
Don't Let Hidden Costs Erode Your Profit Margins
On paper, profit margin formulas appear straightforward. In the complex reality of B2B commerce, however, they can provide a dangerously incomplete picture. Relying solely on standard calculations can lead to an inflated sense of profitability.
Numerous "hidden" costs consistently work to erode margins. A product that appears profitable can quickly become a loss leader once all associated expenses are properly accounted for. For business leaders, mastering profit margin calculation means moving beyond the simple (Revenue - COGS) equation to address the details that define true financial performance.

Beyond COGS: Identifying the True Cost of a Sale
Your Cost of Goods Sold is merely the starting point. A true profitability analysis must account for every expense incurred in delivering a product to a customer and handling post-sale activities. Many of these costs are variable and can fluctuate significantly.
Here is a checklist of common yet often overlooked costs:
- Payment Processing Fees: Services like Stripe or PayPal charge fees, typically 2.5% to 3.5%, on every transaction.
- Marketplace Commissions: Selling on platforms like Amazon or eBay involves substantial fees, often 15% or more, which must be treated as a direct cost of sale for that channel.
- Shipping and Fulfillment: This includes not just postage but also packaging materials, warehouse labor, and any fees paid to a third-party logistics (3PL) provider.
- Cost of Returns (Reverse Logistics): A significant expense. Returns involve costs for shipping, inspection labor, restocking, and potential product write-offs. A single return can erase the profit from a sale.
Overlooking even one of these cost categories can have a material impact. For instance, if you successfully applied strategies from our guide on how to negotiate with suppliers to reduce COGS by 5%, that gain could be completely negated by unmonitored increases in shipping rates or a higher-than-average return rate.
Mini Use Case: How Marketplace Fees Impact Profitability
An ecommerce brand sells a product for $150 on a popular online marketplace. They target a 15% net profit margin, or $22.50 per unit. Their COGS and operating expenses are well-managed. However, they fail to model the marketplace's 15% commission ($22.50) as a direct cost of sale for that channel.
This single oversight completely eliminates their expected profit on every unit sold through that marketplace. Their net margin on that channel is effectively 0%. Multiplying this across thousands of sales reveals a critical flaw in their channel strategy that was hidden by blended, company-wide margin calculations.
The most dangerous costs are the incremental, recurring ones that go unmonitored. A few percentage points from fees, shipping overages, and returns can accumulate to erase the entire net margin of a product or sales channel.
Factoring in Discounts and Compliance Costs
Two additional areas where margin calculations often fall short are promotional discounts and compliance activities. These are not minor adjustments; they are direct deductions from your potential profit.
Discounts, Rebates, and Promotions Every discount or promotional code directly reduces revenue for that transaction. If a product with a standard 40% gross margin is sold with a 15% discount, the effective gross margin on that sale drops to 25% before any other costs are considered. It is critical to track the true cost of customer acquisition and loyalty initiatives.
MAP Enforcement and Compliance For manufacturers and brands, enforcing pricing policies is essential for channel health and long-term brand equity. The associated costs are real and should be included in your operating expenses.
- Monitoring Software: Subscriptions for platforms that track reseller pricing are a necessary operational cost.
- Legal Fees: Enforcing Minimum Advertised Price (MAP) or Recommended Retail Price (RRP) policies may require legal counsel.
- Administrative Overhead: Staff time is required to identify violations, communicate with resellers, and manage the enforcement process.
These compliance activities protect your brand value and ensure a fair market for your retail partners, thereby safeguarding your long-term margins. Ignoring these costs provides an inaccurate view of your operational efficiency. This is precisely where automated tools like Market Edge deliver value by providing the data to enforce MAP policies efficiently, freeing up your team from manual tracking.
Using Competitive Intelligence to Protect Your Margins
Calculating your internal profit margins is the first step. The next, more challenging step is defending those margins in a dynamic market. Every pricing decision made by a competitor creates a ripple effect that can directly impact your profitability on every sale.
This is where internal financial data must be integrated with external market intelligence. Without a clear view of competitor activities, you are operating with a significant blind spot. A pricing strategy that appears sound in isolation can quickly become a liability if a competitor makes an aggressive price cut, eroding your sales volume and leaving you with excess inventory.
Attempting to track this manually is no longer feasible. The volume of data—across multiple sellers, marketplaces, and regions—makes manual monitoring inefficient and prone to error.
Moving from Reactive to Proactive Margin Defense
Automated price monitoring tools provide the real-time data needed to anticipate and respond to market shifts. Instead of discovering lost sales after the fact, you can see competitive pricing changes as they happen, enabling you to make informed adjustments that protect your market position and profitability.
These platforms continuously track competitor prices, stock levels, and promotions for the products you sell. This provides a live view of the competitive landscape, allowing you to make decisions that balance competitiveness with profitability.
For instance, an ecommerce manager can use this intelligence to identify products with sufficient pricing power to absorb a price increase, directly boosting gross margin. Conversely, they can pinpoint where a competitor's aggressive pricing threatens a key product line, enabling a targeted, temporary price match instead of a broad, margin-destroying discount.
Enforce MAP to Prevent Margin Erosion
For manufacturers and brands, reseller violations of your Minimum Advertised Price (MAP) policy pose a significant threat to profitability. When one reseller undercuts your established price, it often triggers a domino effect. Other retailers feel compelled to match the lower price, leading to widespread price degradation that can crush margins across your entire distribution channel.
Manually policing dozens or hundreds of online resellers is an impossible task. Violations can appear and disappear in hours, making them difficult to detect and document. This is where automated monitoring becomes an essential tool for brand protection.
By implementing a system to track reseller pricing, you can receive instant alerts when an advertised price falls below your MAP threshold. This allows for immediate action.
- Immediate Detection: The system identifies the specific reseller and product in violation.
- Documented Evidence: It provides a time-stamped record of the violation, which is crucial for enforcement.
- Swift Resolution: You can contact the non-compliant seller promptly to resolve the issue, protecting your brand's value and maintaining a level playing field for your partners.
Platforms like Market Edge are designed specifically for this purpose, helping brands automate MAP enforcement and stop margin erosion before it escalates. For a deeper look at this process, you can check out our guide on competitive intelligence gathering.
Ultimately, when you combine internal margin analysis with external market data, you create a powerful framework for making pricing decisions that not only attract customers but also, more importantly, protect your bottom line.
Turning Margin Calculations into an Actionable Strategy
Knowing the formulas for profit margin is one thing; using them to build a resilient and profitable business is another. The calculations provide a snapshot, but a repeatable, structured process is what builds momentum and maintains a strategic advantage.
Without a formal process, margin analysis becomes a sporadic task rather than a core strategic tool. The goal is to establish a simple, consistent rhythm that ensures the financial health of your business and enables rapid response to market changes.

Establish a Cadence for Margin Review
The first step is consistency. Standardize how your team calculates margins, ensuring all hidden costs are included. A shared dashboard or template is recommended to create a single source of truth and prevent the use of outdated or inconsistent data.
Next, schedule regular reviews. Treat these sessions as mission-critical meetings.
- Weekly Check-in: A focused review of gross margins on top-selling products. This serves as an early warning system for pricing anomalies or promotions that are eroding profit.
- Monthly Deep Dive: A comprehensive review of operating and net profit margins. This assesses the overall operational efficiency of the business.
- Quarterly Strategy Session: A high-level analysis of long-term trends to inform forecasting, budget allocation, and strategic goals for the upcoming quarter.
Segment Your Margin Analysis Beyond Company Averages
A single, company-wide profit margin provides a useful health check, but actionable insights are found in the details. To uncover hidden opportunities and costly inefficiencies, you must segment your data.
Analyze your margins by:
- Product or SKU: Identify which items are true profit drivers versus those that are underperforming or, worse, losing money on each sale.
- Product Category: Determine which product lines are most profitable to guide marketing and inventory investment.
- Sales Channel: Compare the profitability of your direct-to-consumer site, marketplaces like Amazon, and wholesale channels. It is common to discover that a high-volume channel is the least profitable after all associated fees are factored in.
This level of detail is transformative. A healthy 15% overall net margin could be masking a high-performing category at 30% and a money-losing category at -5%.
The objective of margin analysis is not to arrive at a single number. It is to uncover the narratives within your data—the hero products, the inefficient channels, and the pricing opportunities that a blended average will always obscure.
Integrate External Market Data for Context
Your internal numbers tell only half the story. To make fully informed decisions, you must benchmark your performance against the competitive landscape. This involves incorporating external market intelligence into your review process.
Knowing that a competitor has just reduced their price on a key product provides the context for a sudden drop in your sales and margin for that item. This external perspective is critical for protecting profit targets, especially in an environment of rising costs. For example, recent industry profit margin trends show how different sectors are navigating economic pressures, with some increasing margins through strategic pricing despite rising supply chain costs.
This is where automated price monitoring solutions like Market Edge become invaluable. They provide the real-time competitor data needed to make pricing adjustments that protect your margins without sacrificing your competitive position.
Common Profit Margin Questions for B2B Leaders
Knowing the formulas is the starting point. Applying them effectively in the complex environment of B2B ecommerce requires addressing practical, real-world questions. Here are some of the most common inquiries from business leaders.
What is a "good" profit margin?
The answer depends entirely on your industry, business model, and market position. A SaaS company might target net margins above 30%, while a high-volume B2B distributor could operate successfully on a 5-8% net margin.
As a general benchmark for ecommerce, many businesses aim for a net profit margin in the 10-20% range. Consistently falling below 10% often indicates that pricing is too aggressive, costs are too high, or both.
The most meaningful benchmark is not a generic industry average but your own historical performance. A consistent, upward trend in your margins over time is a stronger indicator of business health than hitting an arbitrary external target.
How do I calculate the profit margin on a single product?
Calculating margin at the SKU level is essential for identifying your most and least profitable products. This requires a granular analysis of unit economics to determine each product's true contribution to the bottom line.
To do this, you must calculate the "fully landed cost" per unit. This includes:
- The direct cost of the item (COGS)
- Inbound shipping and duties, allocated on a per-unit basis
- An allocated portion of fulfillment and warehousing costs
- Channel-specific costs like marketplace commissions or payment processing fees
Once you have this comprehensive cost, you can determine the product's true profit contribution. For example, a product selling for $200 with a fully landed cost of $150 generates $50 in profit, for a 25% margin. This level of clarity is critical for optimizing pricing, marketing spend, and inventory decisions.
How often should I calculate profit margins?
Margin analysis cannot be an annual or ad-hoc task. To effectively manage your business, you need a regular cadence for reviewing your numbers. This enables proactive, tactical adjustments rather than reactive crisis management.
Consider this recommended schedule:
- Weekly: A quick review of gross margins for best-sellers and products under promotion. This is your early warning system for margin erosion.
- Monthly: A full analysis of company-wide operating and net profit margins. This serves as a monthly health check for the entire business.
- Quarterly: A strategic, high-level review to analyze trends, adjust forecasts, and set profitability goals for the next quarter.
Adhering to a consistent schedule transforms margin calculation from a simple accounting exercise into a powerful strategic management tool.
This is where automated price monitoring tools like Market Edge become useful. They provide the competitive data required to set intelligent prices and protect your hard-earned margins. Find out how.